

Answered step by step
Verified Expert Solution
Question
1 Approved Answer
See Table # showing financial statement data and stock price data for Mydeco Corp. a. From 2012 to 2016, what was the total cash flow
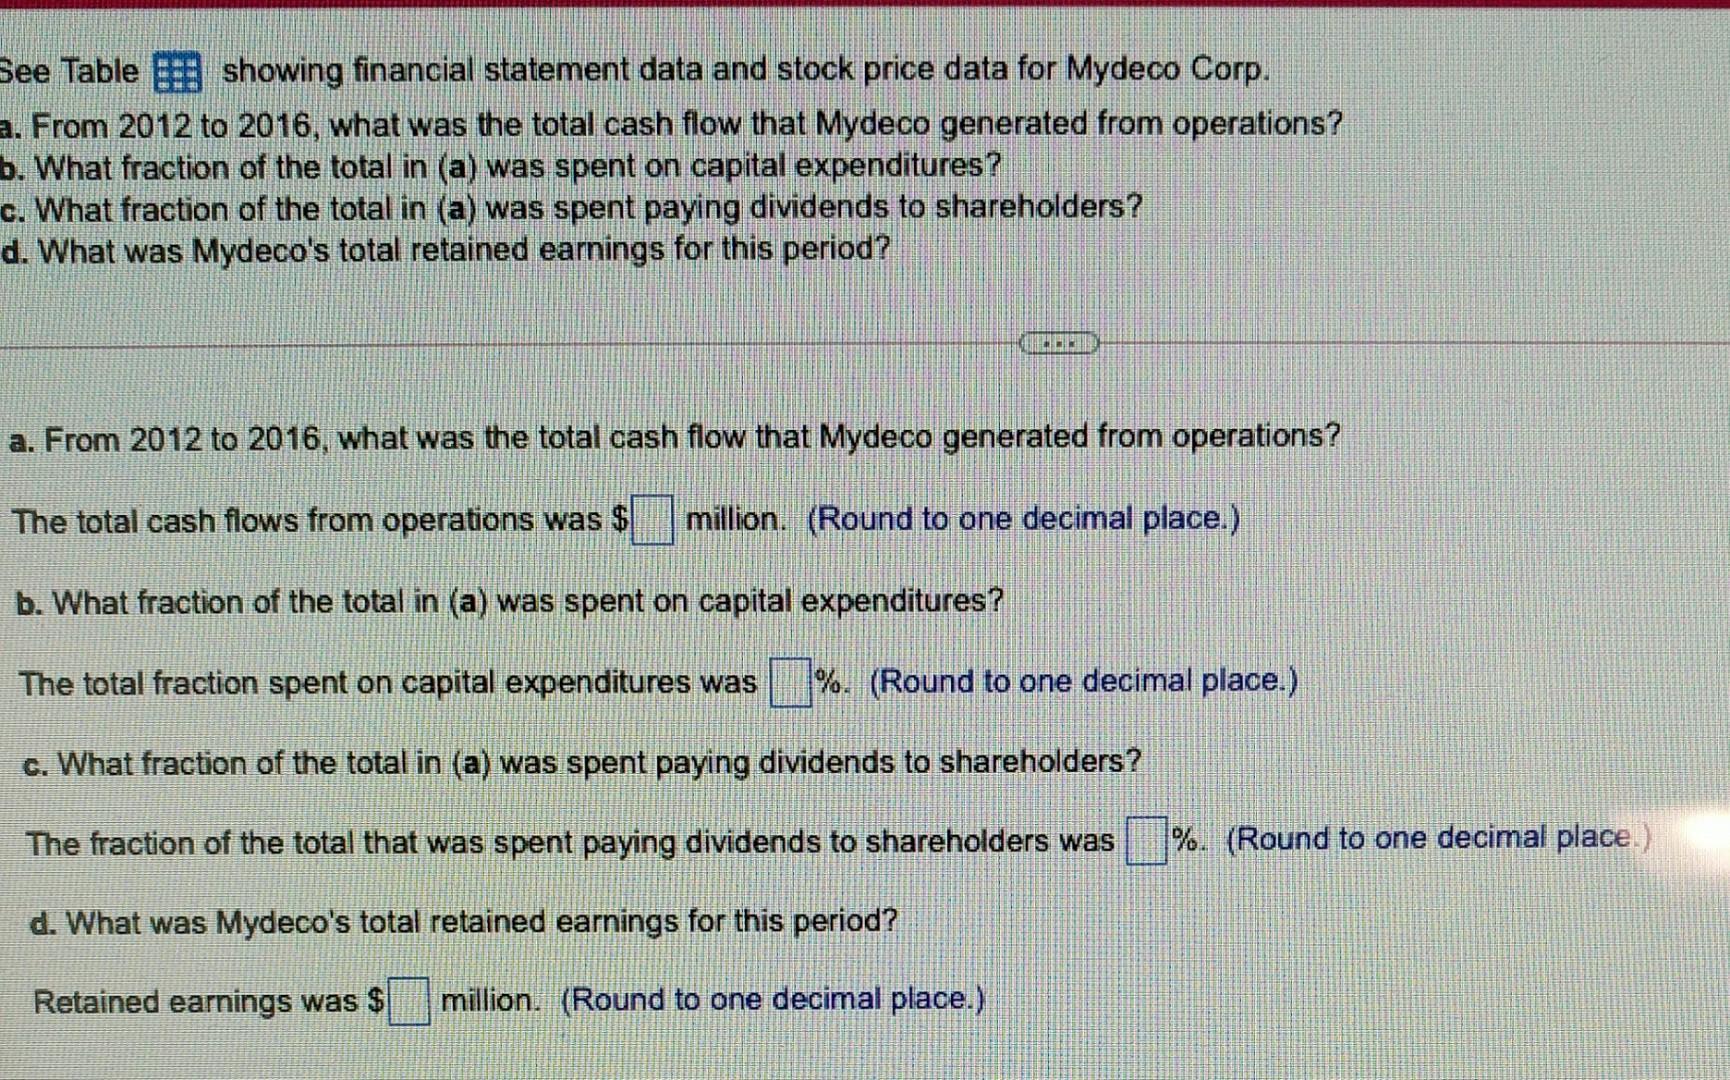
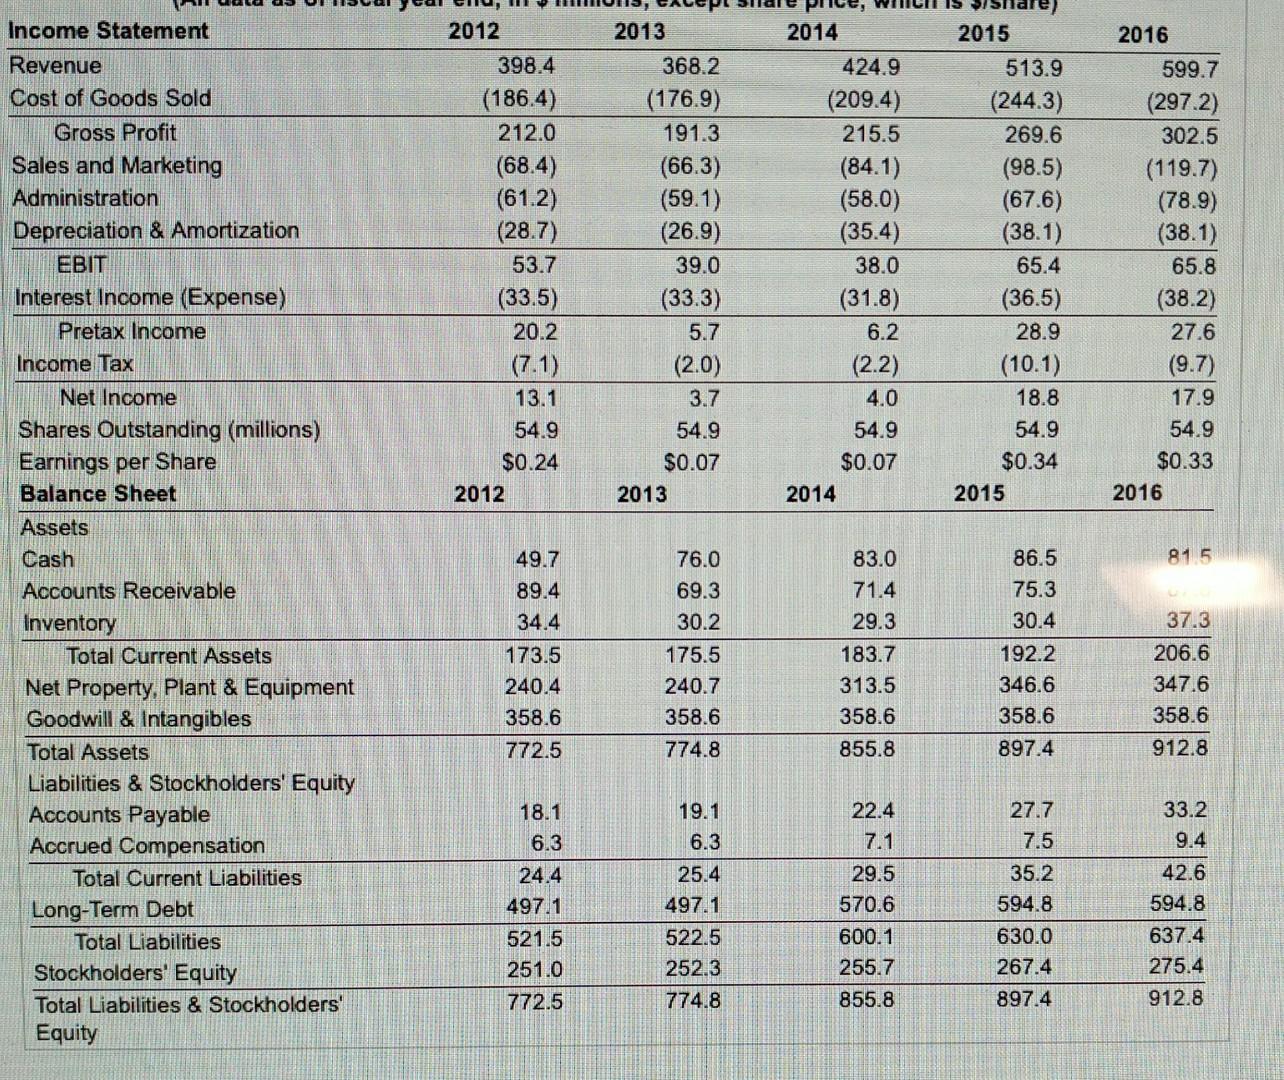
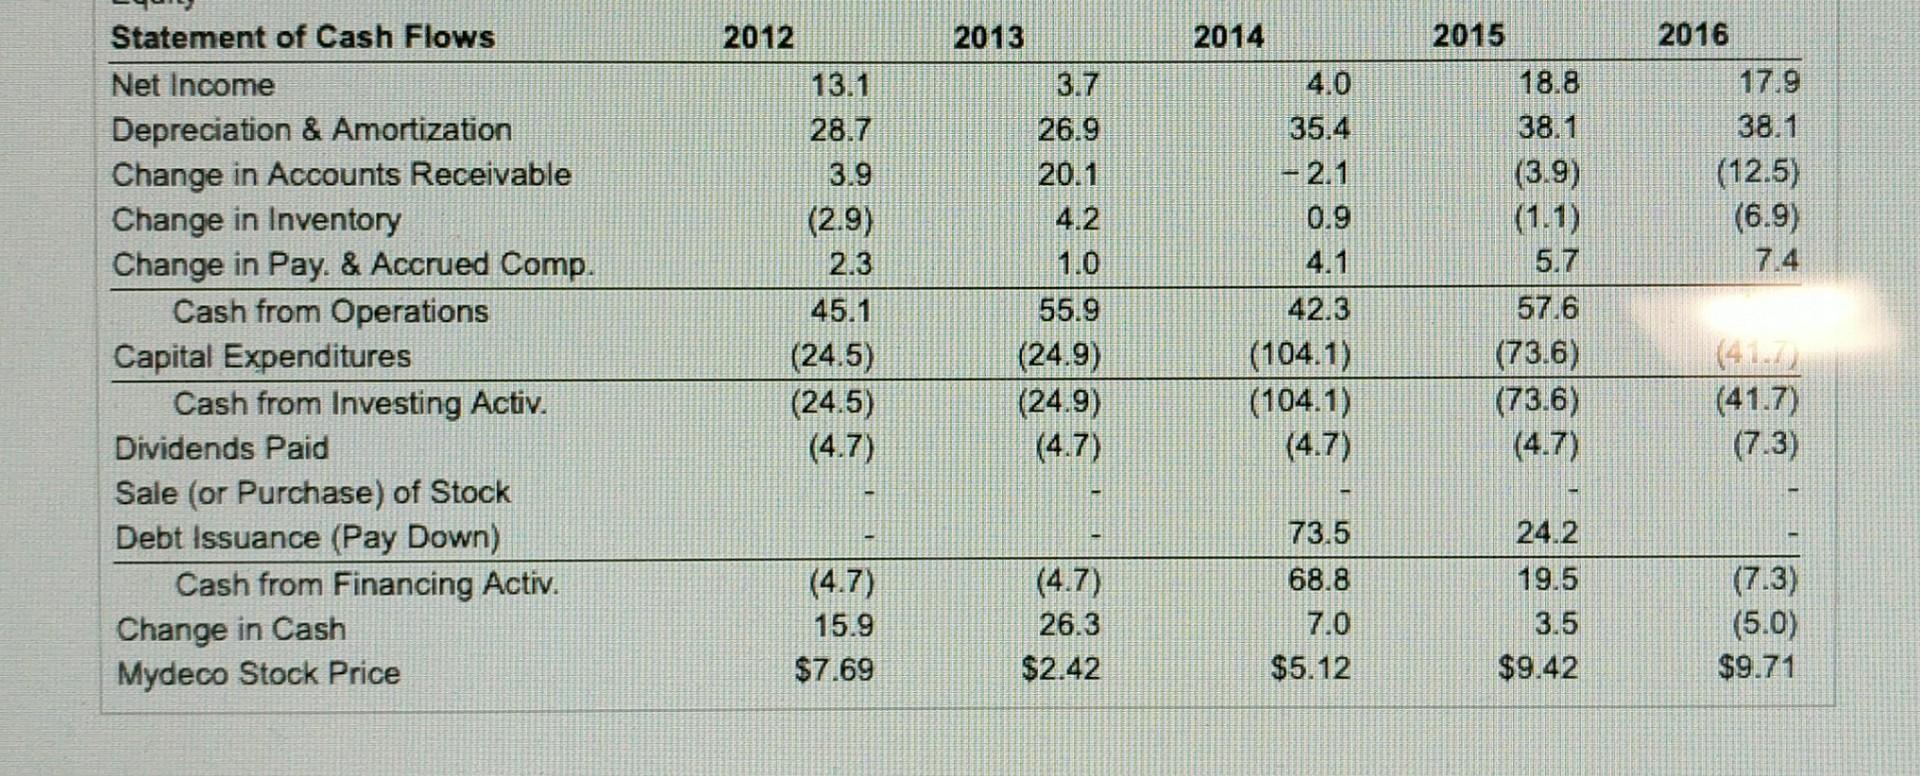
See Table # showing financial statement data and stock price data for Mydeco Corp. a. From 2012 to 2016, what was the total cash flow that Mydeco generated from operations? b. What fraction of the total in (a) was spent on capital expenditures? c. What fraction of the total in (a) was spent paying dividends to shareholders? d. What was Mydeco's total retained earnings for this period? a. From 2012 to 2016, what was the total cash flow that Mydeco generated from operations? The total cash flows from operations was $ million. (Round to one decimal place.) b. What fraction of the total in (a) was spent on capital expenditures? The total fraction spent on capital expenditures was %. (Round to one decimal place.) c. What fraction of the total in (a) was spent paying dividends to shareholders? The fraction of the total that was spent paying dividends to shareholders was %. (Round to one decimal place.) d. What was Mydeco's total retained earnings for this period? Retained earnings was $ million. (Round to one decimal place.) Income Statement Revenue Cost of Goods Sold Gross Profit Sales and Marketing Administration Depreciation & Amortization EBIT 2012 398.4 (186.4) 212.0 (68.4) (61.2) (28.7) 53.7 (33.5) 20.2 (7.1) 13.1 54.9 $0.24 2012 2013 368.2 (176.9) 191.3 (66.3) (59.1) (26.9) 39.0 (33.3) 5.7 (2.0) 3.7 54.9 $0.07 2013 2014 424.9 (209.4) 215.5 (84.1) (58.0) (35.4) 38.0 (31.8) 6.2 (2.2) 4.0 54.9 $0.07 2014 2015 513.9 (244.3) 269.6 (98.5) (67.6) (38.1) 65.4 (36.5) 28.9 (10.1) 18.8 54.9 $0.34 2015 2016 599.7 (297.2) 302.5 (119.7) (78.9) (38.1) 65.8 (38.2) 27.6 (9.7) 17.9 54.9 $0.33 2016 815 49.7 89.4 34.4 Interest Income (Expense) Pretax Income Income Tax Net Income Shares Outstanding (millions) Earnings per Share Balance Sheet Assets Cash Accounts Receivable Inventory Total Current Assets Net Property, Plant & Equipment Goodwill & Intangibles Total Assets Liabilities & Stockholders' Equity Accounts Payable Accrued Compensation Total Current Liabilities Long-Term Debt Total Liabilities Stockholders' Equity Total Liabilities & Stockholders' Equity 173.5 240.4 358.6 772.5 76.0 69.3 30.2 175.5 240.7 358.6 774.8 83.0 71.4 29.3 183.7 313.5 358.6 855.8 86.5 75.3 30.4 192.2 346.6 358.6 897.4 37.3 206.6 347.6 358.6 912.8 19.1 6.3 33.2 9.4 42.6 18.1 6.3 24.4 497.1 521.5 251.0 772.5 25.4 497.1 522.5 252.3 774.8 22.4 7.1 29.5 570.6 600.1 255.7 855.8 27.7 7.5 35.2 594.8 630.0 267.4 897.4 594.8 637.4 275.4 912.8 2012 2014 4.0 35.4 - 2.1 0.9 Statement of Cash Flows Net Income Depreciation & Amortization Change in Accounts Receivable Change in Inventory Change in Pay. & Accrued Comp. Cash from Operations Capital Expenditures Cash from Investing Activ. Dividends Paid Sale (or Purchase) of Stock Debt Issuance (Pay Down) Cash from Financing Activ. Change in Cash Mydeco Stock Price 13.1 28.7 3.9 (2.9) 2.3 45.1 (24.5) (24.5) (4.7) 2013 3.7 26.9 20.1 4.2 1.0 55.9 (24.9) (24.9) (4.7) 2015 18.8 38.1 (3.9) (1.1) 5.7 57.6 (73.6) (73.6) (4.7) 2016 17.9 38.1 (12.5) (6.9) 7.4 42.3 (104.1) (104.1) (4.7) (41.7) (7.3) (4.7) 15.9 $7.69 (4.7) 26.3 $2.42 73.5 68.8 7.0 $5.12 24.2 19.5 3.5 $9.42 (713) (5.0) $9.71
Step by Step Solution
There are 3 Steps involved in it
Step: 1

Get Instant Access to Expert-Tailored Solutions
See step-by-step solutions with expert insights and AI powered tools for academic success
Step: 2

Step: 3
Ace Your Homework with AI
Get the answers you need in no time with our AI-driven, step-by-step assistance
Get Started
The Laymans Guide To Managing Your Investments
Authors: Thomas Dunleavy
1st Edition
979-8763592214