

Answered step by step
Verified Expert Solution
Question
1 Approved Answer
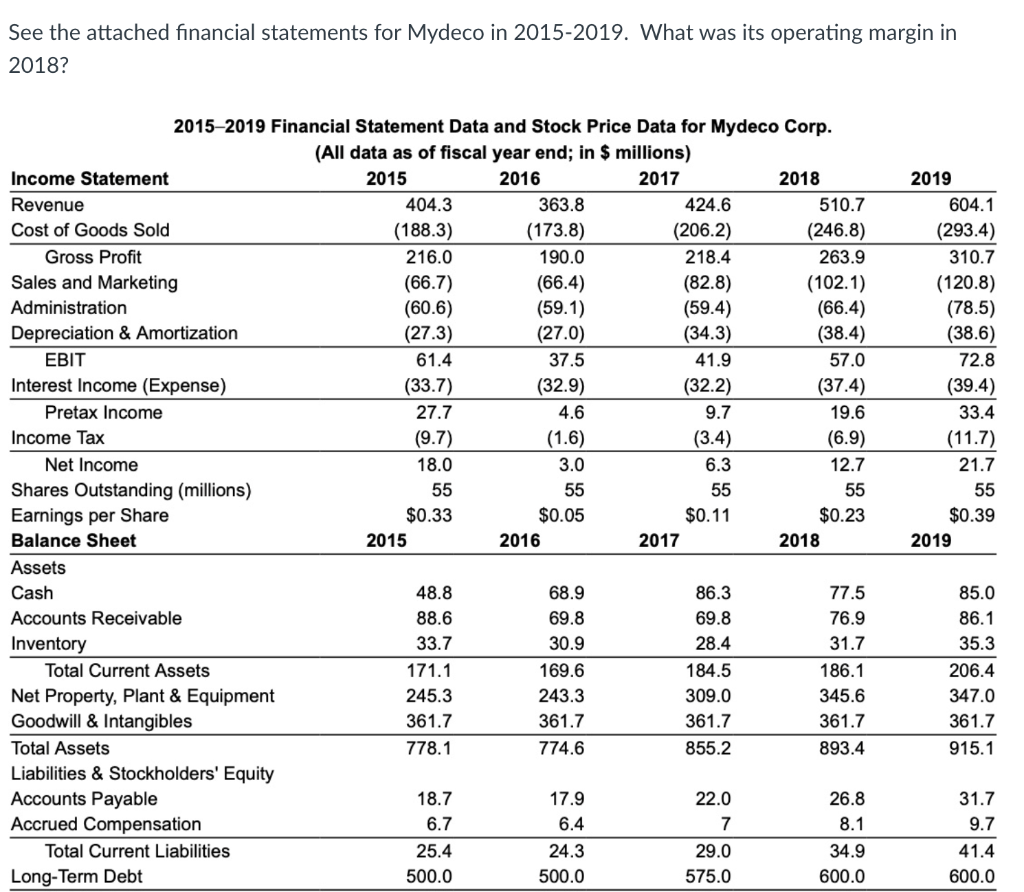
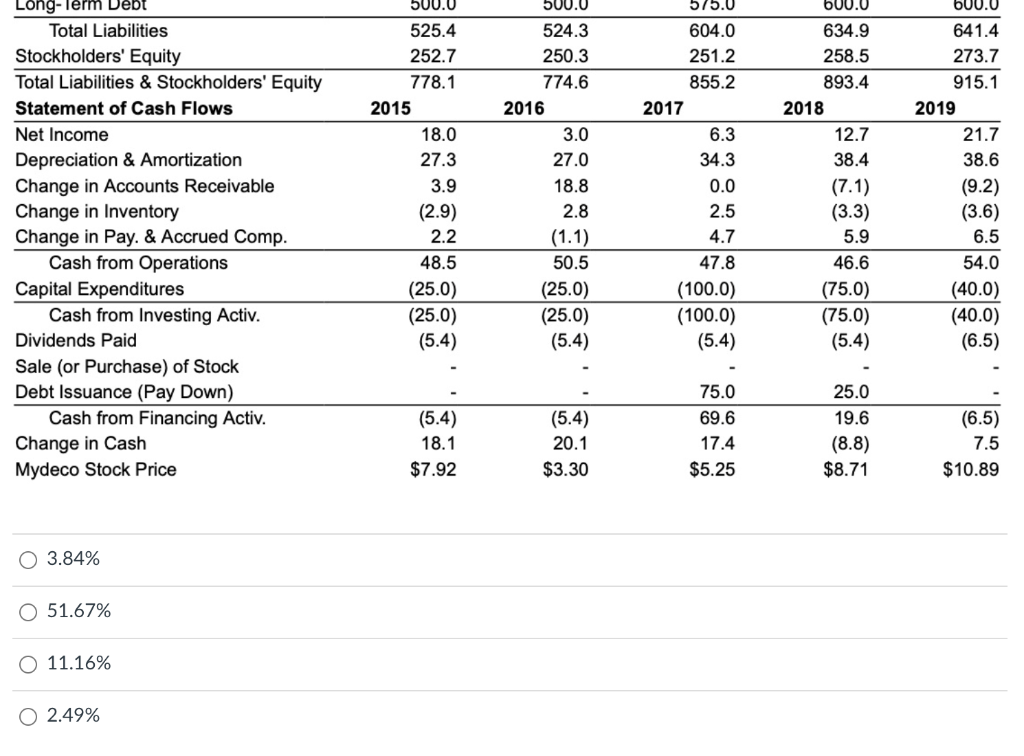
See the attached financial statements for Mydeco in 2015-2019. What was its operating margin in 2018? 2015-2019 Financial Statement Data and Stock Price Data for
Step by Step Solution
There are 3 Steps involved in it
Step: 1

Get Instant Access to Expert-Tailored Solutions
See step-by-step solutions with expert insights and AI powered tools for academic success
Step: 2

Step: 3
Ace Your Homework with AI
Get the answers you need in no time with our AI-driven, step-by-step assistance
Get Started
Computational Finance Using C And C #
Authors: George Levy DPhil University Of Oxford
1st Edition
0750669195, 978-0750669191