Answered step by step
Verified Expert Solution
Question
1 Approved Answer
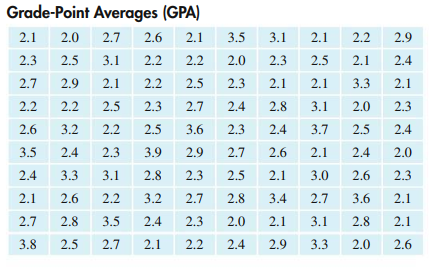
See the attached grade point averages. One hundred seniors were chosen at random from a graduating class at a university and their grade-point averages recorded.

See the attached grade point averages. One hundred seniors were chosen at random from a graduating class at a university and their grade-point averages recorded.
A) construct a frequency and relative frequency table using a class interval of 0.2 starting at 1.95
B) Construct a frequency polygon and a cumulative frequency polygon
C) What is the probability of a GPA drawn at random from the sample being over 2.95?
D) Construct a cumulative frequency and relative cumulative frequency table.
Please explain steps so I can learn. Thank you
3.5 3.1 2.1 2.2 2.9 2.0 2.3 2.1 2.4 2.3 2.1 3.3 2.1 Grade-Point Averages (GPA) 2.1 2.0 2.7 2.6 2.1 2.3 2.5 3.1 2.2 2.2 2.7 2.9 2.1 2.2 2.5 2.2 2.2 2.5 2.3 2.7 2.6 3.2 2.2 2.5 3.6 3.5 2.4 2.3 3.9 2.9 2.4 3.3 3.1 2.8 2.3 2.4 2.8 2.5 2.1 3.1 3.7 2.1 2.0 2.3 2.3 2.4 2.5 2.4 2.7 2.4 2.0 2.6 2.1 2.5 3.0 2.6 2.3 2.1 2.6 2.2 3.2 2.7 2.8 3.4 2.7 3.6 2.1 2 2.7 2.8 3.5 2.4 2.3 2.0 2.1 3.1 2.8 2.1 3.8 2.5 2.7 2.1 2.2 2.4 2.9 3.3 2.0 2.6 3.5 3.1 2.1 2.2 2.9 2.0 2.3 2.1 2.4 2.3 2.1 3.3 2.1 Grade-Point Averages (GPA) 2.1 2.0 2.7 2.6 2.1 2.3 2.5 3.1 2.2 2.2 2.7 2.9 2.1 2.2 2.5 2.2 2.2 2.5 2.3 2.7 2.6 3.2 2.2 2.5 3.6 3.5 2.4 2.3 3.9 2.9 2.4 3.3 3.1 2.8 2.3 2.4 2.8 2.5 2.1 3.1 3.7 2.1 2.0 2.3 2.3 2.4 2.5 2.4 2.7 2.4 2.0 2.6 2.1 2.5 3.0 2.6 2.3 2.1 2.6 2.2 3.2 2.7 2.8 3.4 2.7 3.6 2.1 2 2.7 2.8 3.5 2.4 2.3 2.0 2.1 3.1 2.8 2.1 3.8 2.5 2.7 2.1 2.2 2.4 2.9 3.3 2.0 2.6Step by Step Solution
There are 3 Steps involved in it
Step: 1

Get Instant Access to Expert-Tailored Solutions
See step-by-step solutions with expert insights and AI powered tools for academic success
Step: 2

Step: 3

Ace Your Homework with AI
Get the answers you need in no time with our AI-driven, step-by-step assistance
Get Started


