See the "Time Series" data. You are a manufacturer of outdoor picnic furniture (benches, picnic tables, litter receptacles, etc.). You are planning your bench product line's demand for purchasing and production scheduling.
1. Optimize your forecast and provide the alpha, beta and forecast error.
2. Provide the forecast for month's 25, 26, 27
3. If a Pandemic hits the world late in month 24, how would you forecast months 25, 26 and 27? Think about this from the perspective of this specific company.
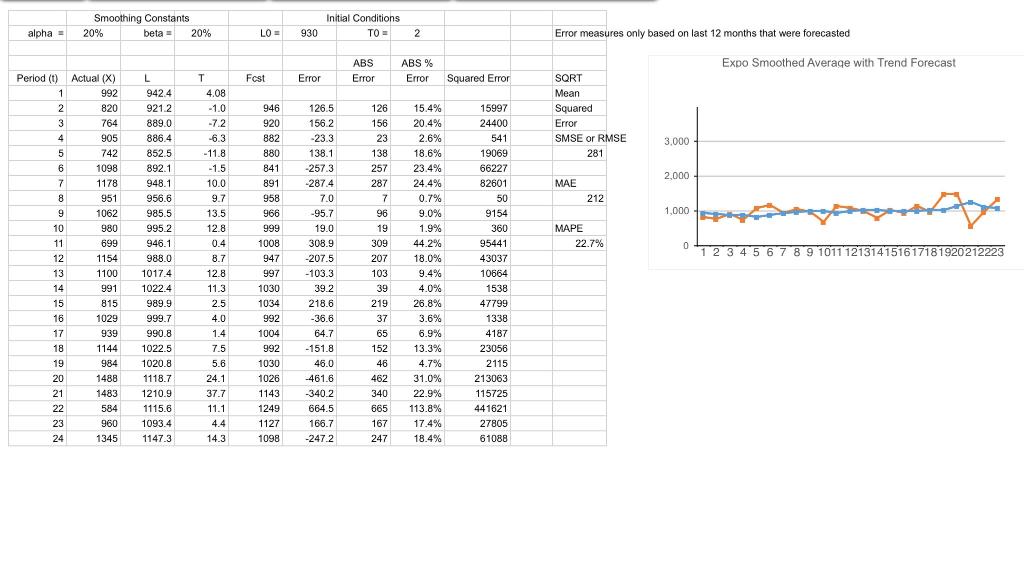
Smoothing Constants 20% beta = 20% Initial Conditions TO alpha = LO 930 2 Error measures only based on last 12 months that were forecasted ABS Error ABS % Error Expo Smoothed Average with Trend Forecast Fest Error Squared Error Period (0) 1 2 2 3 946 SORT Mean Squared Error SMSE or RMSE 281 4 3.000 Actual (X) 992 820 764 905 742 1098 1178 951 1062 980 699 5 5 6 7 8 126 156 23 138 257 287 920 882 880 841 891 958 966 999 126.5 1562 -23.3 138.1 -257.3 -2874 7.0 -95.7 2,000 T 4.08 -1.0 -7.2 -6.3 .-11.8 -1.5 10.0 9.7 13.5 12.8 0.4 8.7 12.8 11.3 2.5 4.0 MAE 212 7 96 1,000 19.0 19 MAPE 22.7% 0 L 942.4 9212 889.0 886.4 852.5 892.1 948.1 956.6 985.5 9952 946.1 988.0 1017.4 1022.4 989.9 999.7 990.8 1022.5 1020.8 1118.7 1210.9 1115.6 1093.4 11473 9 9 10 11 12 13 14 15 16 17 1 2 3 4 5 6 7 8 9 1011121314151617181920212223 1154 1100 991 815 1029 1008 947 997 1030 1034 992 1004 992 1030 1026 309 207 103 39 219 37 65 15.4% 20.4% 2.6% 18.6% 23.4% 24.4% 0.7% 9.0% 1.9% 44.2% 18.0% 9.4% 4.0% 26.8% 3.6% 6.9% 13.3% 4.7% 31.0% 22.9% 113.8% 17.4% 18.4% 15997 24400 541 19069 66227 82601 50 9154 360 95441 43037 10664 1538 47799 1338 4187 23056 2115 213063 115725 441621 27805 61088 308.9 -207.5 -103.3 39.2 218.6 -36.6 64.7 -151.8 46.0 -461.6 340 2 664.5 166.7 -2472 1.4 7.5 152 46 939 1144 984 1488 1483 584 960 18 19 20 21 22 23 24 462 5.6 24.1 37.7 11.1 4.4 14.3 1143 1249 340 665 167 1127 1098 1345 247 Smoothing Constants 20% beta = 20% Initial Conditions TO alpha = LO 930 2 Error measures only based on last 12 months that were forecasted ABS Error ABS % Error Expo Smoothed Average with Trend Forecast Fest Error Squared Error Period (0) 1 2 2 3 946 SORT Mean Squared Error SMSE or RMSE 281 4 3.000 Actual (X) 992 820 764 905 742 1098 1178 951 1062 980 699 5 5 6 7 8 126 156 23 138 257 287 920 882 880 841 891 958 966 999 126.5 1562 -23.3 138.1 -257.3 -2874 7.0 -95.7 2,000 T 4.08 -1.0 -7.2 -6.3 .-11.8 -1.5 10.0 9.7 13.5 12.8 0.4 8.7 12.8 11.3 2.5 4.0 MAE 212 7 96 1,000 19.0 19 MAPE 22.7% 0 L 942.4 9212 889.0 886.4 852.5 892.1 948.1 956.6 985.5 9952 946.1 988.0 1017.4 1022.4 989.9 999.7 990.8 1022.5 1020.8 1118.7 1210.9 1115.6 1093.4 11473 9 9 10 11 12 13 14 15 16 17 1 2 3 4 5 6 7 8 9 1011121314151617181920212223 1154 1100 991 815 1029 1008 947 997 1030 1034 992 1004 992 1030 1026 309 207 103 39 219 37 65 15.4% 20.4% 2.6% 18.6% 23.4% 24.4% 0.7% 9.0% 1.9% 44.2% 18.0% 9.4% 4.0% 26.8% 3.6% 6.9% 13.3% 4.7% 31.0% 22.9% 113.8% 17.4% 18.4% 15997 24400 541 19069 66227 82601 50 9154 360 95441 43037 10664 1538 47799 1338 4187 23056 2115 213063 115725 441621 27805 61088 308.9 -207.5 -103.3 39.2 218.6 -36.6 64.7 -151.8 46.0 -461.6 340 2 664.5 166.7 -2472 1.4 7.5 152 46 939 1144 984 1488 1483 584 960 18 19 20 21 22 23 24 462 5.6 24.1 37.7 11.1 4.4 14.3 1143 1249 340 665 167 1127 1098 1345 247