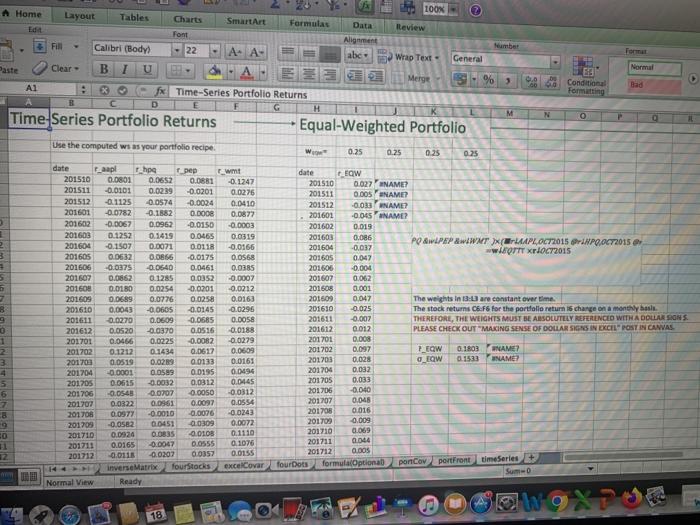
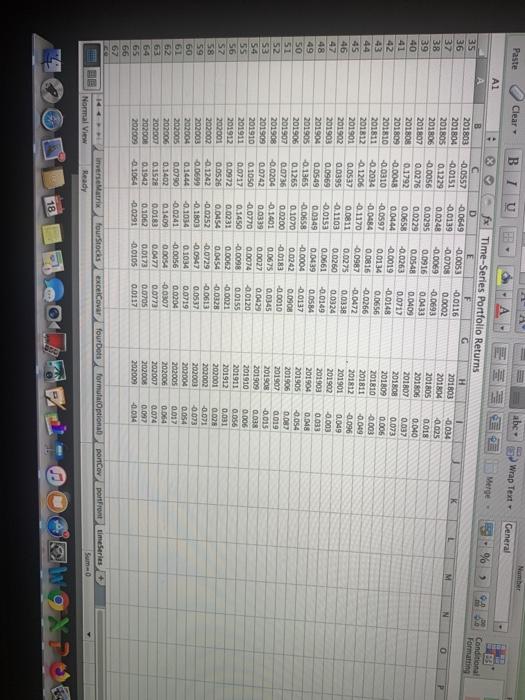
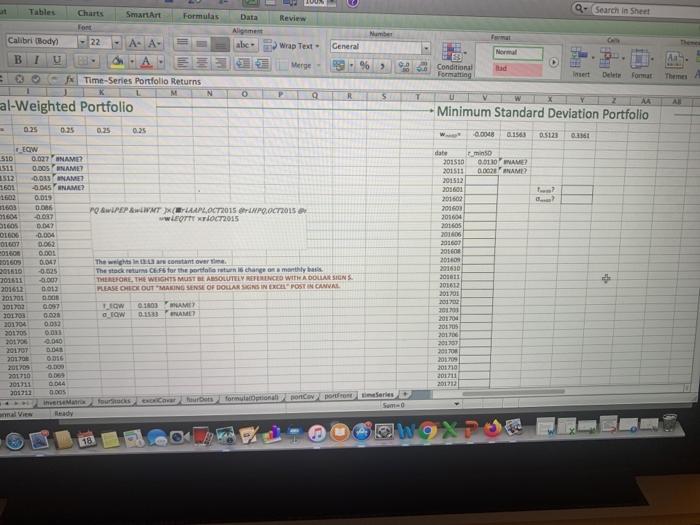
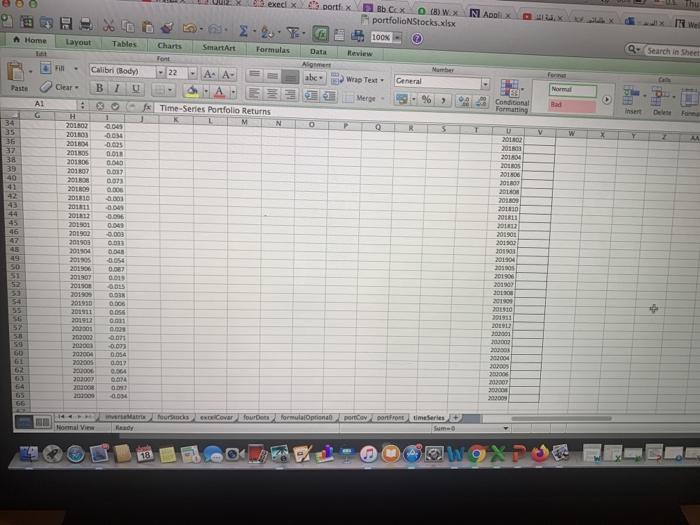
See timeSeries sheet in portfolioNStocks.xlsx and compute the 60 monthly returns of the maximum Sharpe ratio portfolio Compute each stocks beta apainst the maximum Sharpe ratio portfolio using SLOPE function. Then. AAPLs bets is 1.41 HPQ's beta is PEP's betais and WMTS betais Two digits-only report 0.54 or 0.77 rather than 0.536 or 0.7704, respectively) Normal 100X A Home Layout Tables Charts SmartArt Formulas Data Ileview Edit Font Alignment Number FIN Calibri (Body) 22 A. A abc. Wrap Text General Clear U Merge - % 3 Al 2 X - Time-Series Portfolio Returns B D E G H M Time Series Portfolio Returns Equal-Weighted Portfolio Use the computed ws as your portfolio recipe 0.25 0.25 0.0 0 ES Conditional Formatting Bad N O 0.25 0.25 date 2 3 - B 0 1 2 3 date Fanpl Thpg pep 201510 Faw 0.0801 0.0652 0.0881 -0.1247 201510 201511 -0.0101 0.0239 0.027' NAME? -0.0201 0.0276 201511 0.005 NAME? 201512 -0.1125 -0.0574 -0.0024 0.0410 201512 201601 -0.023 NAME? -0.0782 -0.1882 0.0008 0.0872 201601 201602 -0.045 INAME? -0.0067 0.0962 -0.0150 -0.0003 201602 0.019 201603 0.1252 0.1419 0.0465 0.0319 201608 0.086 201604 -0.1507 0.0071 PO & PEP WWNT (MAPL.02/2015 Srp0072015 0.0118 -0.0166 201604 -0.037 201605 0.0632 ww XROC 2015 0.0816 -0.0175 0.0568 201605 0.047 201606 -0.0375 -0.0640 0.0461 0.0385 201606 -0.004 201607 0.0862 0.1285 0.0352 -0.0007 201607 0.062 201608 0.0180 0.0254 -0.0201 -0.0212 201608 0.001 201609 0.0689 0.0776 0.0258 0.0163 201609 0.047 The weights in 13-15 are constant over time. 201610 0.0043 -0.0605 -0.0145 -0.0296 201610 -0.025 The stock returns C.F6 for the portfolio return 15 change on a monthly basi 201611 0.0270 0.06.09 0.0685 0.0058 201611 -0.007 THEREFORE, THE WEIGHTS MUST BE ABSOLUTELY REFERENCED WITH A DOLLAR SONS 201612 0.0520 -0.0370 0.0516 -0.0188 201612 0.012 PLEASE CHECK OUT "MAKING SENSE OF DOLLAR SIGN IN EXCEL"POST IN CANVAS 201701 0.0466 0.0225 0.0082 -0.0279 201701 0.008 201702 0.1212 0.1434 1803 0.0617 0.0609 201702 0.097 F_EQW NAME? 201703 0.0519 0.029 0.0133 0.0161 201703 0.028 QW 0.1533 NAME? 201704 -0.0001 0.0589 0.0195 0.0494 201704 0.032 201705 0.0615 -0.0032 0.0312 0.0145 0.033 201705 201706 -0.09 0.0207 0.0050 -0.0312 201706 -0.040 201707 0.0322 0.0961 0.0091 0.0554 201707 0.045 201708 0.0977 -0.0010 -0.0076 -0.0243 0.016 201708 201709 -0.052 0.0451 0.009 -0.0309 0.0072 201702 201710 0.0924 0.083 0.0108 0.1110 201710 0.069 201711 0.0165 -0.0067 D.O555 0.1076 201711 0.044 201712 0.0116 -0.0207 0.0357 0.00 0.0155 201712 fourstocks excelovar four Dots inverse Matrix formulacOptional poncov portfront timeSeries Sumo Normal View Ready 5 7 50 11 18 Paste Clear B 1 U abe Wrap Text Ceneral A1 A 96 BS Conditional Formatting K N 0 35 36 37 38 39 40 41 42 45 46 47 48 49 50 51 52 53 54 55 56 SZ 58 59 60 61 52 63 64 65 66 67 - X R c 201803 -0.0557 201804 -0.0151 201805 0.1229 201806 -0.0056 201807 0.0276 201808 0.1792 201809 -0.0048 201810 -0.0310 201811 -0.2014 201812 -0.1206 201901 0.0537 201902 0.0395 201903 0.0969 201904 0.0549 201903 -0.1365 201906 0.1265 201907 0.0736 20190 -0.0204 201509 0.0742 201910 0.1050 201911 0.0717 201912 0.0972 202001 0.0526 202002 -0.1242 202003 0.0699 202004 0.1444 202005 0.0790 202006 0.1402 202007 0.1528 202008 0.1942 202009 1064 Time-Series Portfolio Returns D H -0.0649 -0.0053 -0.0116 201803 -0.0139 -0.0708 0.0002 0.0248 201804 -0.0069 -0.0693 0.0295 201805 0.0916 0.0433 201806 0.0229 0.0540 0.0409 201807 0.0658 -0.0263 0.0012 201808 0.0444 0.0019 -0.0148 201809 -0.0597 0.0134 0.0656 201810 -0.0484 0.0815 -0.0266 201811 -0.1170 0.0987 -0.0472 201812 0.0811 0.0275 00338 201901 -0.1103 0.0260 0.0324 201902 -0.0153 0.0661 -0.0149 201903 0.0349 0.0439 0.0584 201904 0.0658 -0.0004 -0.0137 201905 0.1070 0.0242 0.0908 201206 0.0200 -0.0183 -0.0010 201907 0 14001 0.0675 0.0345 201905 0.0339 0.0027 0.0429 201909 -0.0770 0.0074 -0.0120 201910 0.1450 -0.0098 0.0155 201911 0.0231 0.0062 -0.0021 201912 0.0454 0.0454 -0.0328 202001 -0.0252 -0.0729 -0.0613 202002 -0.1803 -0.0947 0.0537 202003 -0.1034 0.1034 0.0719 202004 -0.0241 -0.0056 0.0204 202005 0.1409 0.0054 -0.0307 202006 0.0183 0.0477 0.0773 202007 0.1062 0.0173 0.0705 200000 -0.0291 0.0117 202009 -0.034 -0.025 0.018 0.040 0.037 0.073 0.005 -0.003 -0.009 -0.096 0.049 -0.003 0.033 0.018 -0.054 0.083 0.019 -0.015 0.038 0.006 0.056 0,031 0.02 -0.071 0.073 0.054 0.017 0.064 0.074 0.037 0.034 -0.0105 ferie Matrix fourStocks excelovar four Dots formulacOptional pontCorportFront time series Suma 0 Normal View Ready og 18 Tables Charts Q- Search in Sheet SmartArt Formulas Data Review Algement Number Calibri Body 22 A- A- Wrap Text U General 999 - % Merge Conditional Formatting Ibid Insert Delete Format Themes - Time-Series Portfolio Returns M al-Weighted Portfolio N O P R 5 Minimum Standard Deviation Portfolio 0.25 0.25 0.25 0.25 0.0048 0.1543 2.5123 07361 date mins 201510 0.010 WAME 201511 0.002 NAME? 201512 201601 201602 201608 201604 20160S 2010 2016 20560 2010 201630 201011 EW 510 0.027 INAME 1511 0.BOS NAME? 3512 0.035 NAME 1601 -0.0145 NAME 0.015 31603 0.0 1604 -0.007 PO ALPEPITHAPA, OCT2015 POOC 2015 BIOS WWLETT XT OCT2015 D. OLX -0.004 160 DO 50100 DO 201609 0047 The well constant over the -0.025 The state for the portion is change or smarthly basis 201611 -0.00 THEREFORE, THE WERTS MUST BE ABSOLUTELY REFERENCED WITH A DOLL SIGNS 201612 001 PLEASE NOTOUT MAKING SENSE OF DOLLAR SIGNS IN EO POST IN CANVAL 201701 DIE 002 LOW MUME 201703 093 GROW 0:13 AM 201704 0.02 201705 201708 0.000 2017 D. 20170 2017 - 201710 201711 OD 201712 Tours Courts formulational Confronteres Sumo 201701 20170 201203 2010 201 US 2010 201701 2017 2017 201710 2017 201712 18 execi x portfx Bb Cex () W.X N olx portfolioNStocks.xlsx Home 100% Layout Tables Charts 6. 2. 2... SmartArt Formulas Al A. A abe Data Q- Search is heel Review Font Calibri Body 22 Wrap Text General Paste Normal Merge - AL G Bad Conditional Formatting Time-Series Portfolio Returns insert H 34 M 1 2045 -0.00 N O Q R T A w 36 37 38 39 40 41 42 45 46 47 201507 2013 20130 201 DS 201806 201807 201308 2009 201310 201811 2011 201501 201900 201903 2015 20170 2019 201507 20150 201909 2015 201411 20191 2000 202002 20300 203008 202005 30000 203007 2000 0.01 000 0.007 Das 0.000 -0.00 -0.00 -0.006 0.04 0.00 Com 0.0 3054 0.087 0.01 0.005 DON 0.000 U 2010 201503 201804 2010S 20180 2018 2010 201609 2011 2018 2012 201901 201300 2018 201504 201003 201900 2010 20130 201909 2010 201311 2012 50 51 54 25 0. . 6.07 0.02 19 2000W 29 0.07 GIGA GO G3 64 CHO OD 2020 200000 20300 66 hours Cover for en formulalOptional proportimeteries La View Ready 18 See timeSeries sheet in portfolioNStocks.xlsx and compute the 60 monthly returns of the maximum Sharpe ratio portfolio Compute each stocks beta apainst the maximum Sharpe ratio portfolio using SLOPE function. Then. AAPLs bets is 1.41 HPQ's beta is PEP's betais and WMTS betais Two digits-only report 0.54 or 0.77 rather than 0.536 or 0.7704, respectively) Normal 100X A Home Layout Tables Charts SmartArt Formulas Data Ileview Edit Font Alignment Number FIN Calibri (Body) 22 A. A abc. Wrap Text General Clear U Merge - % 3 Al 2 X - Time-Series Portfolio Returns B D E G H M Time Series Portfolio Returns Equal-Weighted Portfolio Use the computed ws as your portfolio recipe 0.25 0.25 0.0 0 ES Conditional Formatting Bad N O 0.25 0.25 date 2 3 - B 0 1 2 3 date Fanpl Thpg pep 201510 Faw 0.0801 0.0652 0.0881 -0.1247 201510 201511 -0.0101 0.0239 0.027' NAME? -0.0201 0.0276 201511 0.005 NAME? 201512 -0.1125 -0.0574 -0.0024 0.0410 201512 201601 -0.023 NAME? -0.0782 -0.1882 0.0008 0.0872 201601 201602 -0.045 INAME? -0.0067 0.0962 -0.0150 -0.0003 201602 0.019 201603 0.1252 0.1419 0.0465 0.0319 201608 0.086 201604 -0.1507 0.0071 PO & PEP WWNT (MAPL.02/2015 Srp0072015 0.0118 -0.0166 201604 -0.037 201605 0.0632 ww XROC 2015 0.0816 -0.0175 0.0568 201605 0.047 201606 -0.0375 -0.0640 0.0461 0.0385 201606 -0.004 201607 0.0862 0.1285 0.0352 -0.0007 201607 0.062 201608 0.0180 0.0254 -0.0201 -0.0212 201608 0.001 201609 0.0689 0.0776 0.0258 0.0163 201609 0.047 The weights in 13-15 are constant over time. 201610 0.0043 -0.0605 -0.0145 -0.0296 201610 -0.025 The stock returns C.F6 for the portfolio return 15 change on a monthly basi 201611 0.0270 0.06.09 0.0685 0.0058 201611 -0.007 THEREFORE, THE WEIGHTS MUST BE ABSOLUTELY REFERENCED WITH A DOLLAR SONS 201612 0.0520 -0.0370 0.0516 -0.0188 201612 0.012 PLEASE CHECK OUT "MAKING SENSE OF DOLLAR SIGN IN EXCEL"POST IN CANVAS 201701 0.0466 0.0225 0.0082 -0.0279 201701 0.008 201702 0.1212 0.1434 1803 0.0617 0.0609 201702 0.097 F_EQW NAME? 201703 0.0519 0.029 0.0133 0.0161 201703 0.028 QW 0.1533 NAME? 201704 -0.0001 0.0589 0.0195 0.0494 201704 0.032 201705 0.0615 -0.0032 0.0312 0.0145 0.033 201705 201706 -0.09 0.0207 0.0050 -0.0312 201706 -0.040 201707 0.0322 0.0961 0.0091 0.0554 201707 0.045 201708 0.0977 -0.0010 -0.0076 -0.0243 0.016 201708 201709 -0.052 0.0451 0.009 -0.0309 0.0072 201702 201710 0.0924 0.083 0.0108 0.1110 201710 0.069 201711 0.0165 -0.0067 D.O555 0.1076 201711 0.044 201712 0.0116 -0.0207 0.0357 0.00 0.0155 201712 fourstocks excelovar four Dots inverse Matrix formulacOptional poncov portfront timeSeries Sumo Normal View Ready 5 7 50 11 18 Paste Clear B 1 U abe Wrap Text Ceneral A1 A 96 BS Conditional Formatting K N 0 35 36 37 38 39 40 41 42 45 46 47 48 49 50 51 52 53 54 55 56 SZ 58 59 60 61 52 63 64 65 66 67 - X R c 201803 -0.0557 201804 -0.0151 201805 0.1229 201806 -0.0056 201807 0.0276 201808 0.1792 201809 -0.0048 201810 -0.0310 201811 -0.2014 201812 -0.1206 201901 0.0537 201902 0.0395 201903 0.0969 201904 0.0549 201903 -0.1365 201906 0.1265 201907 0.0736 20190 -0.0204 201509 0.0742 201910 0.1050 201911 0.0717 201912 0.0972 202001 0.0526 202002 -0.1242 202003 0.0699 202004 0.1444 202005 0.0790 202006 0.1402 202007 0.1528 202008 0.1942 202009 1064 Time-Series Portfolio Returns D H -0.0649 -0.0053 -0.0116 201803 -0.0139 -0.0708 0.0002 0.0248 201804 -0.0069 -0.0693 0.0295 201805 0.0916 0.0433 201806 0.0229 0.0540 0.0409 201807 0.0658 -0.0263 0.0012 201808 0.0444 0.0019 -0.0148 201809 -0.0597 0.0134 0.0656 201810 -0.0484 0.0815 -0.0266 201811 -0.1170 0.0987 -0.0472 201812 0.0811 0.0275 00338 201901 -0.1103 0.0260 0.0324 201902 -0.0153 0.0661 -0.0149 201903 0.0349 0.0439 0.0584 201904 0.0658 -0.0004 -0.0137 201905 0.1070 0.0242 0.0908 201206 0.0200 -0.0183 -0.0010 201907 0 14001 0.0675 0.0345 201905 0.0339 0.0027 0.0429 201909 -0.0770 0.0074 -0.0120 201910 0.1450 -0.0098 0.0155 201911 0.0231 0.0062 -0.0021 201912 0.0454 0.0454 -0.0328 202001 -0.0252 -0.0729 -0.0613 202002 -0.1803 -0.0947 0.0537 202003 -0.1034 0.1034 0.0719 202004 -0.0241 -0.0056 0.0204 202005 0.1409 0.0054 -0.0307 202006 0.0183 0.0477 0.0773 202007 0.1062 0.0173 0.0705 200000 -0.0291 0.0117 202009 -0.034 -0.025 0.018 0.040 0.037 0.073 0.005 -0.003 -0.009 -0.096 0.049 -0.003 0.033 0.018 -0.054 0.083 0.019 -0.015 0.038 0.006 0.056 0,031 0.02 -0.071 0.073 0.054 0.017 0.064 0.074 0.037 0.034 -0.0105 ferie Matrix fourStocks excelovar four Dots formulacOptional pontCorportFront time series Suma 0 Normal View Ready og 18 Tables Charts Q- Search in Sheet SmartArt Formulas Data Review Algement Number Calibri Body 22 A- A- Wrap Text U General 999 - % Merge Conditional Formatting Ibid Insert Delete Format Themes - Time-Series Portfolio Returns M al-Weighted Portfolio N O P R 5 Minimum Standard Deviation Portfolio 0.25 0.25 0.25 0.25 0.0048 0.1543 2.5123 07361 date mins 201510 0.010 WAME 201511 0.002 NAME? 201512 201601 201602 201608 201604 20160S 2010 2016 20560 2010 201630 201011 EW 510 0.027 INAME 1511 0.BOS NAME? 3512 0.035 NAME 1601 -0.0145 NAME 0.015 31603 0.0 1604 -0.007 PO ALPEPITHAPA, OCT2015 POOC 2015 BIOS WWLETT XT OCT2015 D. OLX -0.004 160 DO 50100 DO 201609 0047 The well constant over the -0.025 The state for the portion is change or smarthly basis 201611 -0.00 THEREFORE, THE WERTS MUST BE ABSOLUTELY REFERENCED WITH A DOLL SIGNS 201612 001 PLEASE NOTOUT MAKING SENSE OF DOLLAR SIGNS IN EO POST IN CANVAL 201701 DIE 002 LOW MUME 201703 093 GROW 0:13 AM 201704 0.02 201705 201708 0.000 2017 D. 20170 2017 - 201710 201711 OD 201712 Tours Courts formulational Confronteres Sumo 201701 20170 201203 2010 201 US 2010 201701 2017 2017 201710 2017 201712 18 execi x portfx Bb Cex () W.X N olx portfolioNStocks.xlsx Home 100% Layout Tables Charts 6. 2. 2... SmartArt Formulas Al A. A abe Data Q- Search is heel Review Font Calibri Body 22 Wrap Text General Paste Normal Merge - AL G Bad Conditional Formatting Time-Series Portfolio Returns insert H 34 M 1 2045 -0.00 N O Q R T A w 36 37 38 39 40 41 42 45 46 47 201507 2013 20130 201 DS 201806 201807 201308 2009 201310 201811 2011 201501 201900 201903 2015 20170 2019 201507 20150 201909 2015 201411 20191 2000 202002 20300 203008 202005 30000 203007 2000 0.01 000 0.007 Das 0.000 -0.00 -0.00 -0.006 0.04 0.00 Com 0.0 3054 0.087 0.01 0.005 DON 0.000 U 2010 201503 201804 2010S 20180 2018 2010 201609 2011 2018 2012 201901 201300 2018 201504 201003 201900 2010 20130 201909 2010 201311 2012 50 51 54 25 0. . 6.07 0.02 19 2000W 29 0.07 GIGA GO G3 64 CHO OD 2020 200000 20300 66 hours Cover for en formulalOptional proportimeteries La View Ready 18


