

Answered step by step
Verified Expert Solution
Question
1 Approved Answer
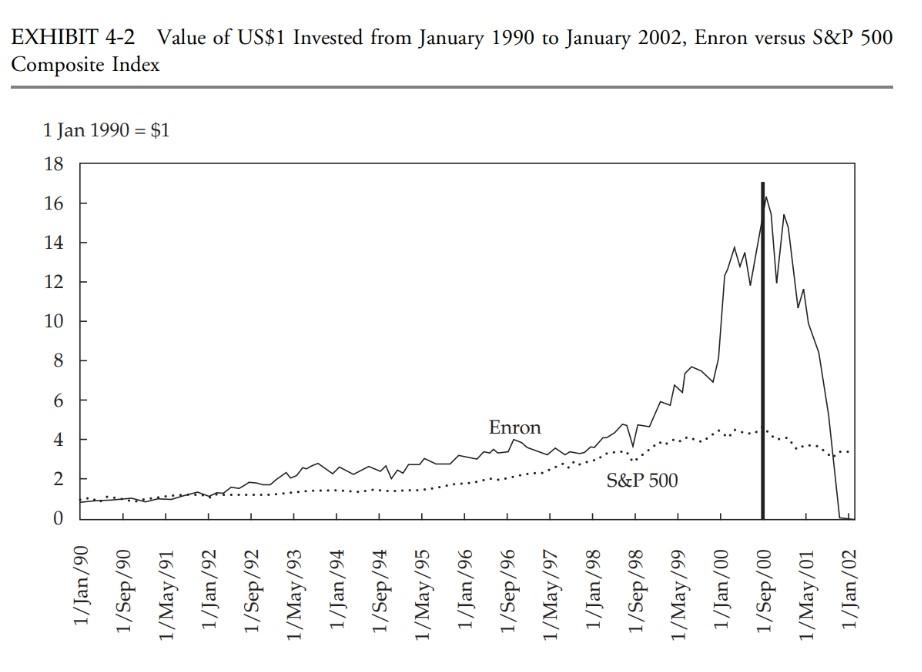
Select 2 U.S. stocks that have either outperformed or underperformed the general market during a specific period of time. Recreate the graph in Exhibit 4-2
- Select 2 U.S. stocks that have either outperformed or underperformed the general market during a specific period of time.
- Recreate the graph in Exhibit 4-2 for your two stocks and the S&P 500. Please use the appropriate time period that is applicable to the 2 stocks that you selected.
- Provide some insight and a high level assessment of the drivers of performance of that stock during that period.
Step by Step Solution
There are 3 Steps involved in it
Step: 1

Get Instant Access to Expert-Tailored Solutions
See step-by-step solutions with expert insights and AI powered tools for academic success
Step: 2

Step: 3
Ace Your Homework with AI
Get the answers you need in no time with our AI-driven, step-by-step assistance
Get Started
Marketing Strategies For Bridal Boutiques
Authors: Marlon Bawer
1st Edition
979-8459594720