

Answered step by step
Verified Expert Solution
Question
1 Approved Answer
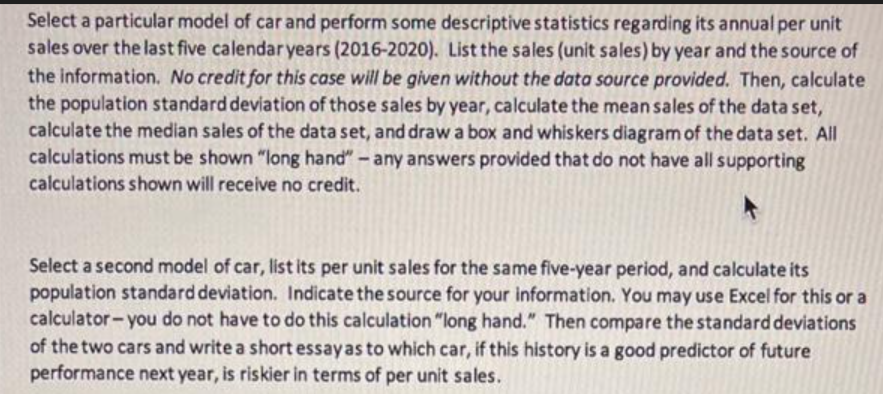
Select a particular model of car and perform some descriptive statistics regarding its annual per unit sales over the last five calendar years (2016-2020). List

Step by Step Solution
There are 3 Steps involved in it
Step: 1

Get Instant Access to Expert-Tailored Solutions
See step-by-step solutions with expert insights and AI powered tools for academic success
Step: 2

Step: 3
Ace Your Homework with AI
Get the answers you need in no time with our AI-driven, step-by-step assistance
Get Started
Elementary Theory Of Numbers
Authors: William J LeVeque
1st Edition
0486150763, 9780486150765