Question
Select and report the inferential statistical test contextualized in the research question. Provide the alpha value and use it to determine the significance of your
- Select and report the inferential statistical test contextualized in the research question.
- Provide the alpha value and use it to determine the significance of your test.
- including statistic value with degree of freedom, p value, and effect size.
- Report the values necessary to interpret the findings and identify the pattern of the relationship (for example, the slope for regression and means for ANOVA).
- Connect the statistical findings back to the research question and conceptual variables.
- Propose an actionable item that uses the results of your findings relevant to the research question.
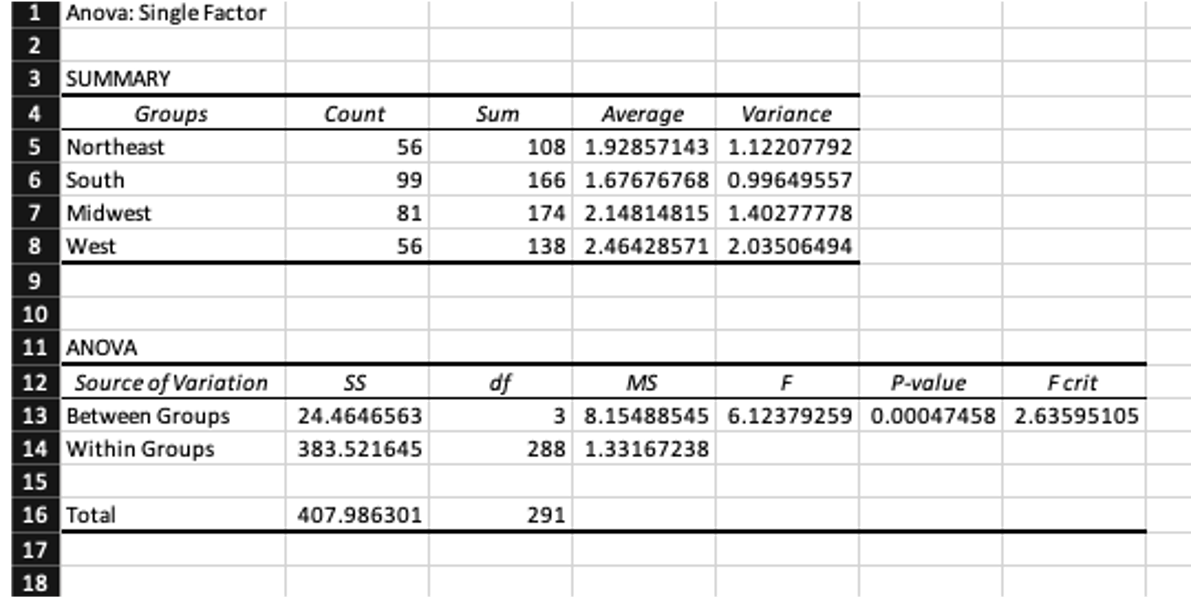
- Provide the output from your data analysis (using the Analysis ToolPak) as a screenshot or picture.
My response so far:
A one-way analysis of variance/ANOVA with =.05 would be most appropriate in this situation when reviewing the attached data to determine the results of the average agreement with homosexuals' freedom to marry one another in four different geographical regions. The Likert Scale was used to determine whether homosexuals should be allowed to marry, with 1 being strongly disagreeand 5 being strongly agree. The average agreement is 1.93 in the Northeast with a variance of 1.12,1.68 in the South with a variance of 1.00, 2.15 in the Midwest with a variance of 1.40, and 2.47 in the West with a variance of 2.04. The sample size of respondents =294. The null hypothesis will be rejected in favor of the alternative as there is a p-value of 0.0004. Normally, a p-value of 0.05 or less is deemed as statistically significant, and in such case, the null hypothesis should be disregarded. The data sample would have three degrees of freedom between groups, and 288 within groups. The degree of freedom for this collection of data was 3 between groups and 288 within groups. Adding the degrees of freedom between groups to the degrees of freedom resulted in a total of 291 degrees of freedom. The sum of the squares for the between-groups sum was 24.46, the within-group sum was 383.52, and the sum of the squares overall came to 407.98. 8.15 and 1.33 were the mean squares within and between groups, respectively.These two figures are combined to give us the F statistic of 6.13.


Step by Step Solution
There are 3 Steps involved in it
Step: 1

Get Instant Access to Expert-Tailored Solutions
See step-by-step solutions with expert insights and AI powered tools for academic success
Step: 2

Step: 3

Ace Your Homework with AI
Get the answers you need in no time with our AI-driven, step-by-step assistance
Get Started


