Question
Select the best XLSTAT printout to answer each question. Required conditions have been met for each question. A significance level of ? = 0.05 is
Select the best XLSTAT printout to answer each question. Required conditions have been met for each question. A significance level of ? = 0.05 is used for each hypothesis test and a confidence level of 95% is used for each confidence interval estimate.
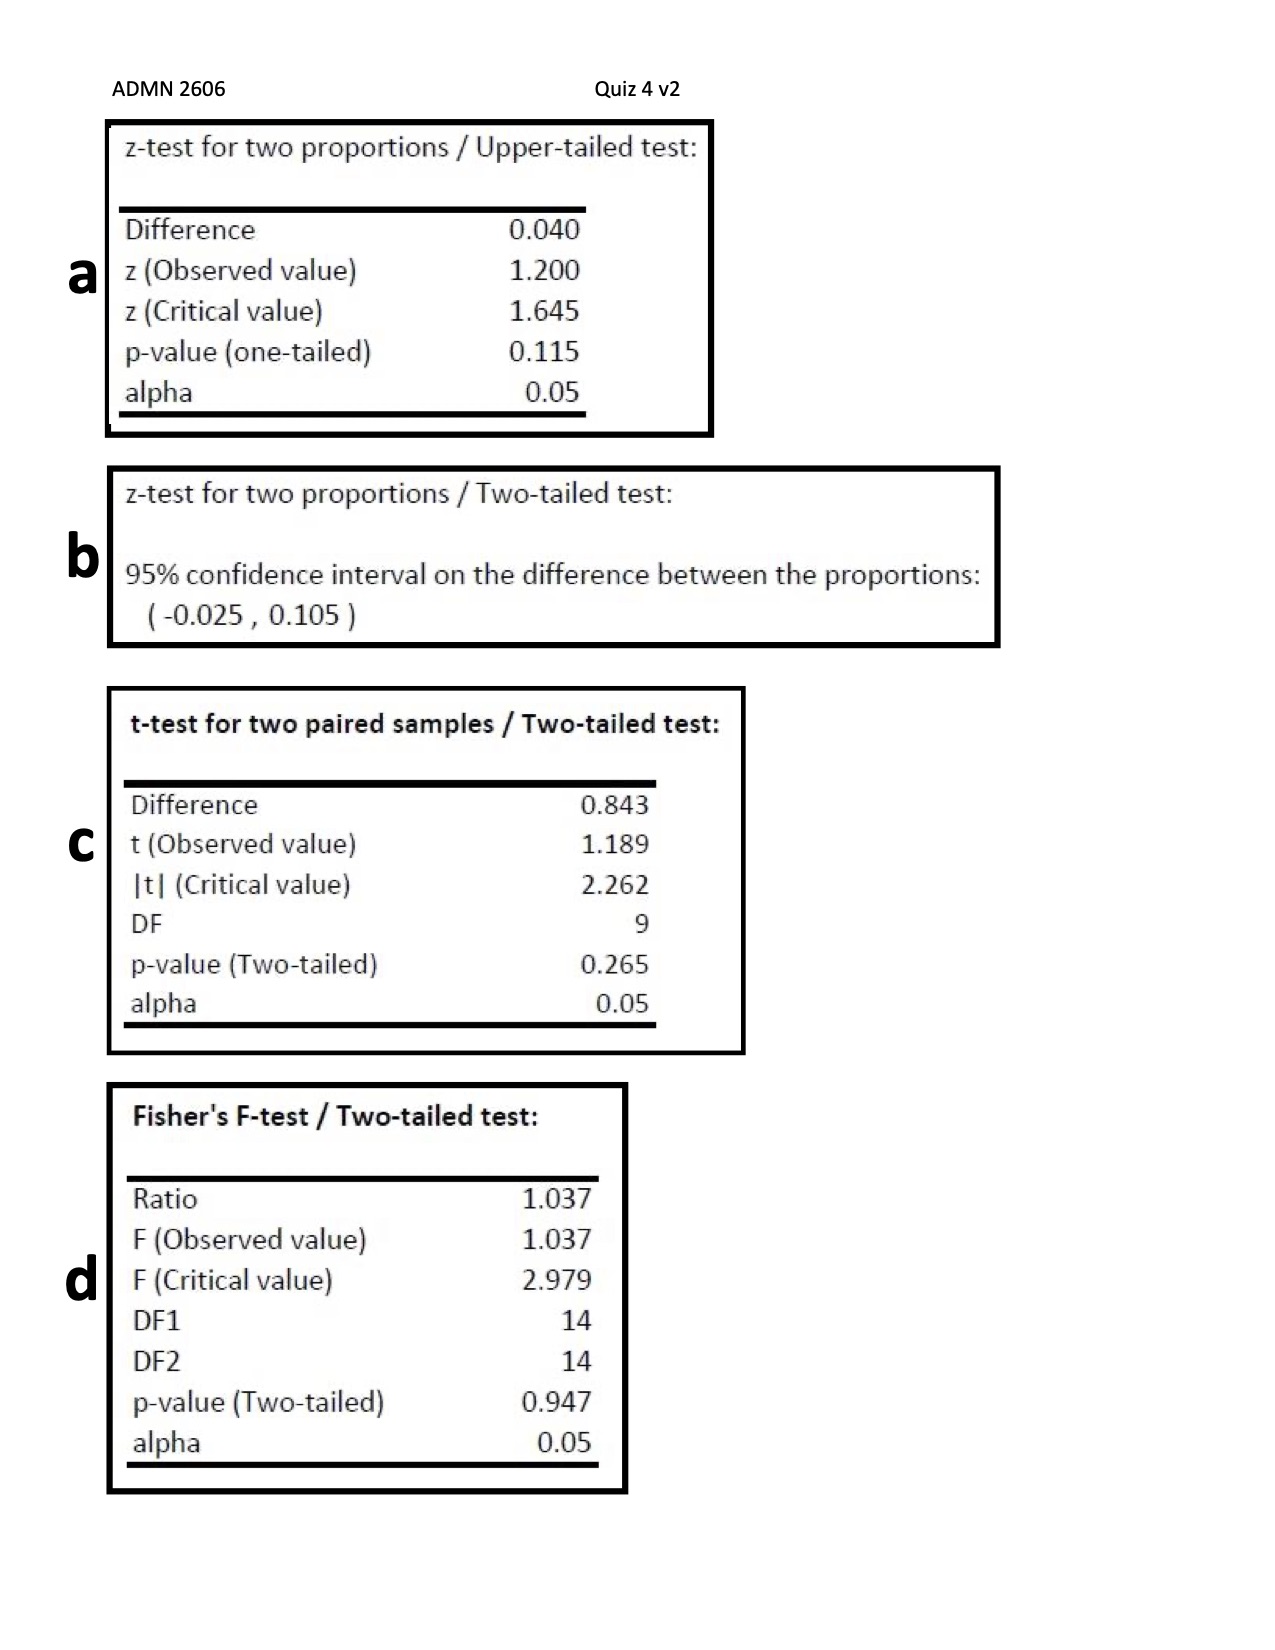
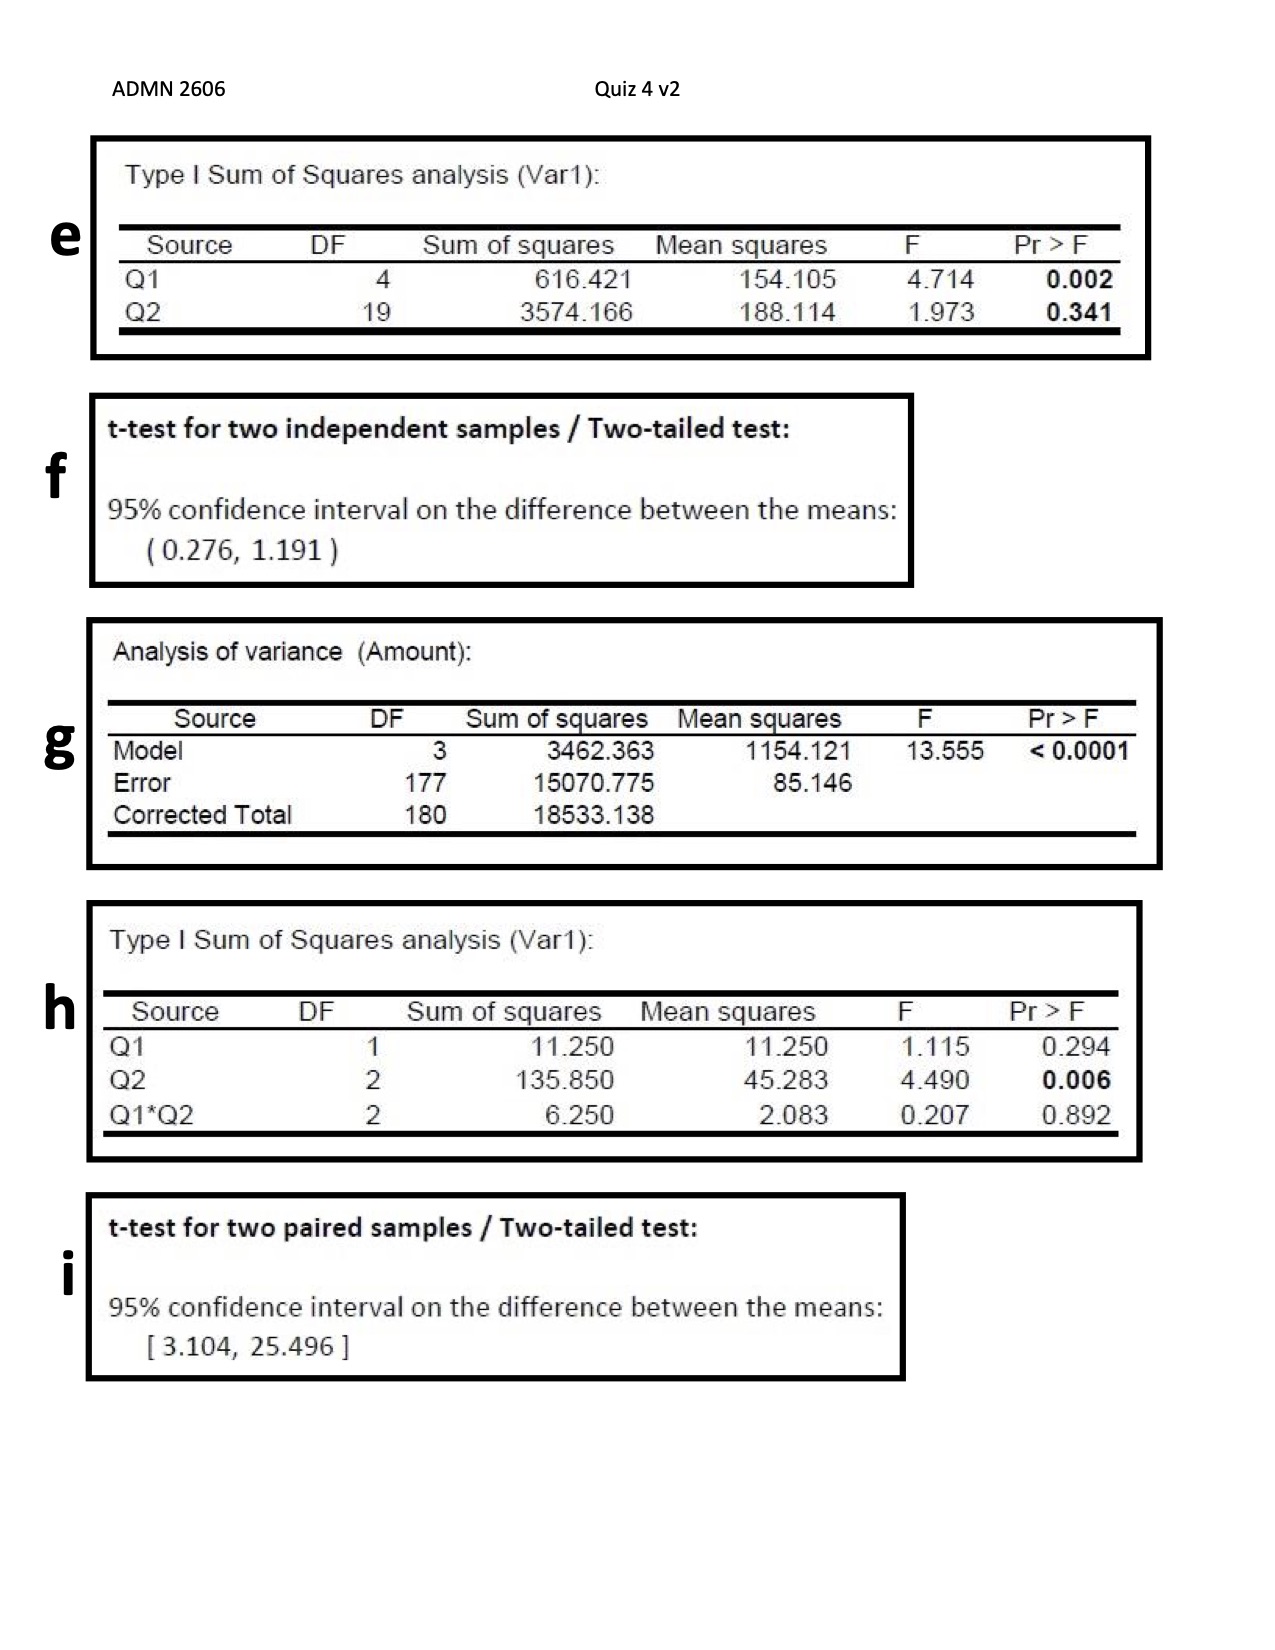
1. Four brands of paint are advertised to dry in the same amount of time. To test this claim, each brand of paint is used to paint the same number of walls. The amount of time for each wall to dry is recorded. Can we infer that there is a difference in the amount of time it takes for each brand of paint to dry?
Printout # ___________________
? : ________________________ ? : ________________________
01
p-value: _____________ Conclusion: Accept ?0 Reject ?0
2. Two jam producers produce jars of strawberry jam. Jars from each producer are weighed and the weights are recorded. Can we infer that the variance in jam jar weights differs between the jam producers?
Printout # ___________________
? : ________________________ ? : ________________________
01
p-value: _____________ Conclusion: Accept ?0 Reject ?0
- It is suspected that in a certain city, waiters receive a different amount of tips than waitresses. To test this claim, many restaurants were chosen from across the city. From each restaurant a waiter and a waitress who worked the same shifts were chosen. The total amount in tips they received in one week was recorded. Estimate the difference between the total weekly tips waiters receive and the total weekly tips waitresses receive.
Printout # ___________________
LCL: _____________________ UCL: _____________________
- To determine whether IPhone users or Android users report a higher level of satisfaction with their phone, a random selection of IPhone users and Android users was selected where one user for each type of phone was 15-20 years old, one user for each type of phone was 20-25 years old, one user for each type of phone was 25-30 years old, and so on. Each user was asked to rate their level of satisfaction with their phone on a scale from 1 to 10 with 10 being the highest level of satisfaction. Can we infer that users of one phone type are more satisfied with their phones than users of the other type?
- Printout # ___________________
- ? : ________________________ ? : ________________________
01
p-value: _____________ Conclusion: Accept ?0 Reject ?0
5. A golfer plays some rounds with her new putter and some rounds with her old putter and records the number of putts for each round. Estimate the difference in the number of putts per round between the new putter and old putter.
Printout # ___________________
LCL: _____________________ UCL: _____________________
6. An electronics store took a random sample of people who purchased a laptop within the last year and recorded if the person paid full-price or a sale price, and whether they purchased an extended warranty. Can we infer that people who pay regular price for a laptop are more likely to purchase an extended warranty?
Printout # ___________________
? : ________________________ ? : ________________________
p-value: _____________ Conclusion: Accept ?0 Reject ?0
7. To compare two different brands of tires the following experiment was designed. Beginning with 6 identical cars, 3 cars have tires of one brand installed on them and the other 3 have tires of the other brand installed on them. One car from each set drives a long pre-determined path on roads. One car from each set drives a long pre-determined path on gravel. One car from each set drives a long pre- determined path on rough, hilly terrain. After each car has driven its path, the amount of wear on the tires is measured and recorded.
a) Can we infer that there are any differences in the amount of wear depending on the brand of tire?
Printout # ___________________
? : ________________________ ? : ________________________
p-value: _____________ Conclusion: Accept ?0 Reject ?0 b) Can we infer that there are any differences in the amount of wear depending
on what terrain is driven (roads, gravel or rough, hilly terrain)?
p-value: _____________ Conclusion: Accept ?0 Reject ?0


Step by Step Solution
There are 3 Steps involved in it
Step: 1

Get Instant Access to Expert-Tailored Solutions
See step-by-step solutions with expert insights and AI powered tools for academic success
Step: 2

Step: 3

Ace Your Homework with AI
Get the answers you need in no time with our AI-driven, step-by-step assistance
Get Started


