Select the Income Statements and Balance Sheets of two corporations from the internet and calculate the following financial ratios:
a. Long-term debt ratios
b. Total debt ratio
c. Times interest earned
d. Cash coverage ration
e. current ratio
f. Quick ratio
g. Operating profit margin
h. Inventory Turnover
i. Days in inventory
j. Average collection period
k. Return on equity
l. Return on assets
m. Payout rations
Compare the financial ratios you have calculated above and write a report on the basis of that comparison.
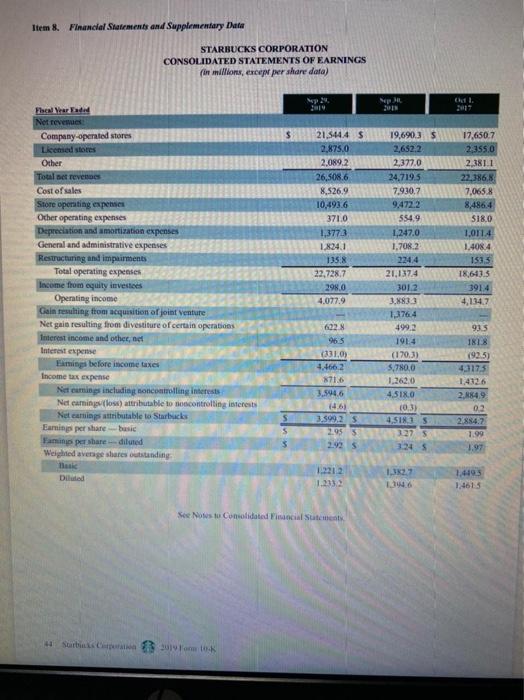
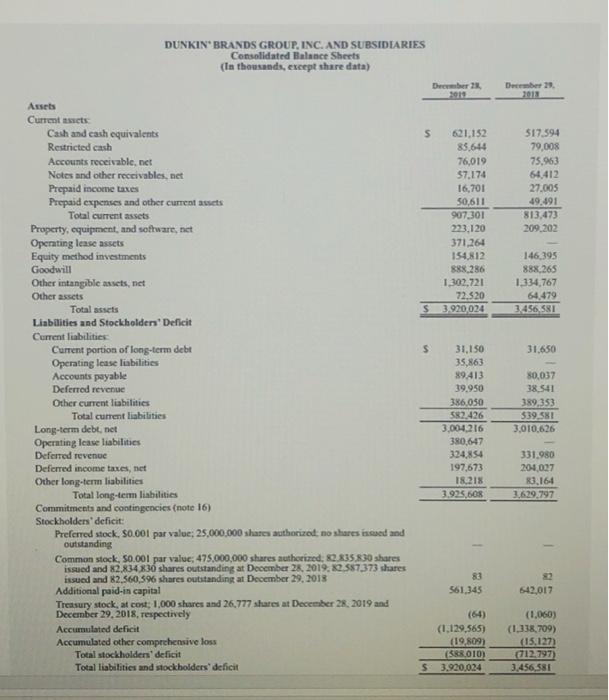
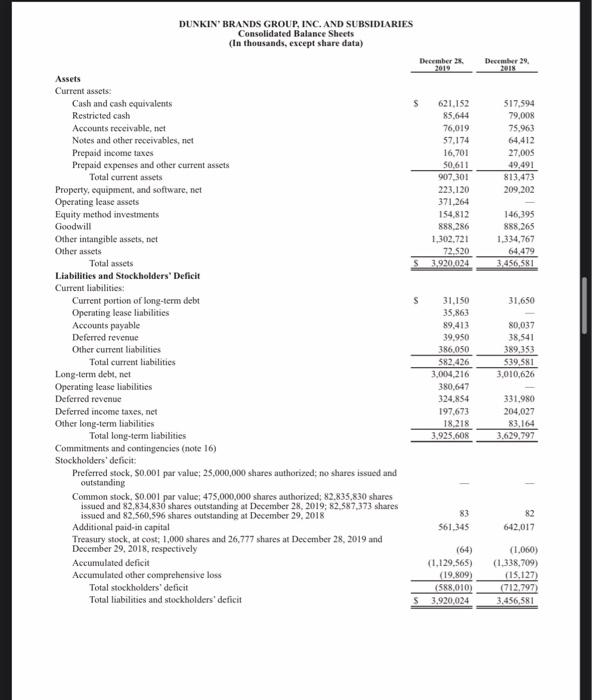
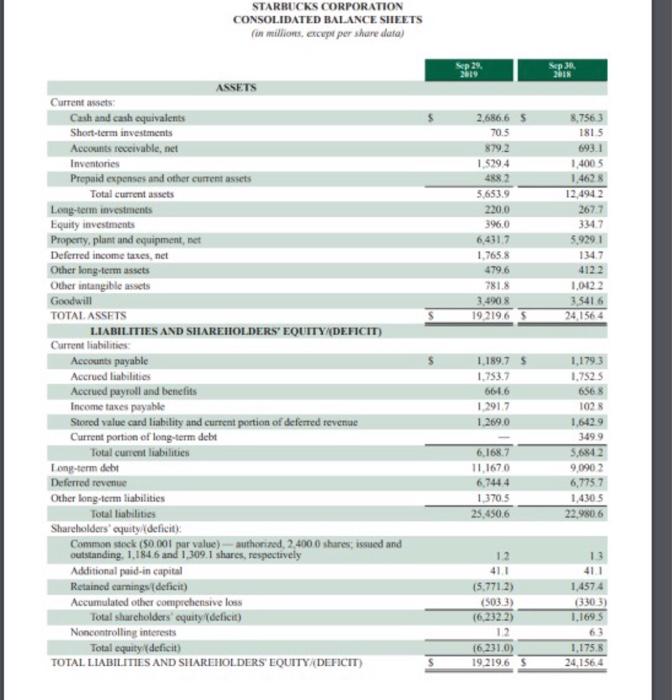
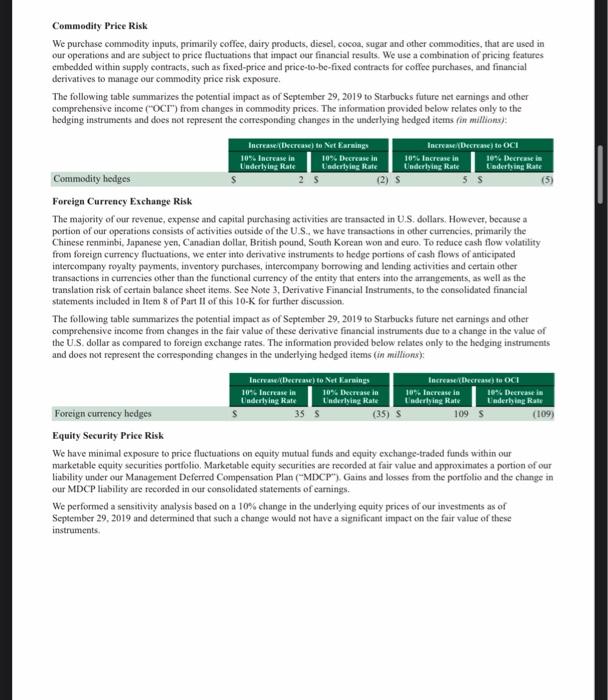
Item 8. Financial Statements and Supplementary Date STARBUCKS CORPORATION CONSOLIDATED STATEMENTS OF EARNINGS (in millions, except per share data) kl. Focal Year Net revenues Company operated stores Licemed stores Other Total net revers Cost of sales Store operating expenses Other operating expenses Depreciation and amortization expenses General and administrative expenses Restructuring and impairments Total operating expenses Income from equity investees Operating income Gain resulting from acquisition of joint venture Net gain resulting from divestiture of certain operations Interest income and other net Interest expense Earnings before income taxes Income tax expense Net cumings including noncontrolling interest Net earningsloss) attributable to controlling interests Net camins attributable to Starbucks Earnings per share busic Famins per share-diluted Weighted average shares outstanding 21.5444 S 2.875.0 2.089.2 26,5086 8.526.9 10,4936 371.0 1,3773 1.8241 1358 22,728.7 1980 4,077.9 17,650.7 23550 2.381.1 22.386,8 7,0658 8,486.4 $18.0 1,0114 1.408.4 1535 19,6903 $ 2,652.2 2.377.0 24,719.5 7.930,7 9,4722 5549 1.247.0 1.708.2 2244 21,1374 301.2 3.8833 1,3764 499,2 1914 (170.3) 5,7800 1.262.0 4.518.0 10.3) 4,51815 1275 324 18,643.5 3914 4.1347 6228 935 96.5 (331,0) 4.4662 871.6 3.594.6 1461 3.399,25 2.955 2.925 IRIA 192.5) 4.3173 1,4326 2.84.9 02 2884.7 1.99 1.97 S S Diluted 1.233 1.327 16 1,493 1.4613 See Nows to Consolidated Financial Statement DUNKIN BRANDS GROUP, INC. AND SUBSIDIARIES Consolidated Balance Sheets (In thousands, except share data) Beber 2013 December 29 2012 S 621.152 85,644 76,019 57.174 16,701 50,611 907.301 223.120 371,264 154,812 888.286 1,302,721 72.520 3.920 024 517.594 79,008 75,963 64.412 27.005 49,491 813.473 209,202 146,395 888.265 1.334,767 64,479 3 456 581 $ 31.650 Assets Current sets Cash and cash equivalents Restricted cash Accounts receivable, net Notes and other receivables, net Prepaid income taxes Prepaid expenses and other current assets Total current assets Property, equipment, and software, net Operating lease assets Equity method investments Goodwill Other intangible assets, net Other assets Total assets Liabilities and Stockholders' Deficit Current liabilities Current portion of long-term debt Operating lease liabilities Accounts payable Deferred revenue Other current liabilities Total current liabilities Long-term debt, net Operating lease liabilities Deferred revenue Deferred income taxes, net Other long-term liabilities Total long-term liabilities Commitments and contingencies (note 16) Stockholders' deficit: Preferred stock, 50.001 par value: 25,000,000 shares authorized: no share issued and outstanding Common stock, 50.001 par value; 475,000,000 shares authorized 2.835 830 shares issued and 82.834 830 shares outstanding at December 28, 2019. 2.587,373 shares issued and 82,560,5% shares outstanding at December 29, 2018 Additional paid in capital Treasury stock, at cost: 1,000 shares and 26,777 stures at December 28, 2019 and December 29, 2018, respectively Accumulated deficit Accumulated other comprehensive loss Total stockholders' deficit Total liabilities and stockholders' deficit 31,150 35,863 89.413 39.950 386.050 582.426 3.004.216 380,647 324.854 197,673 18.21% 3.925,608 80,037 38,541 389,353 $39,581 3,010,626 331.980 204027 83.164 3.629,797 1 83 561,345 2 542.017 (1,129,565) (19.809) (583 010) $ 3.920,024 (1.060) (1.338,709) (15.127 712.797) 3.456,581 December 29 517,594 79,008 75,963 64.412 27,005 49,491 813.473 209,202 146,395 888.265 1,334.767 64,479 3.456,581 31,650 DUNKIN' BRANDS GROUP, INC. AND SUBSIDIARIES Consolidated Balance Sheets (In thousands, except share data) December 2019 Assets Current assets: Cash and cash equivalents 621.152 Restricted cash 85.614 Accounts receivable, net 76,019 Notes and other receivables, net 57.174 Prepaid income taxes 16,701 Prepaid expenses and other current assets 50.611 Total current assets 907.301 Property, equipment, and software, net 223.120 Operating lease assets 371.264 Equity method investments 154,812 Goodwill 888.286 Other intangible assets, net 1,302.721 Other assets 72.520 Total assets 3.920,024 Liabilities and Stockholders' Deficit Current liabilities: Current portion of long-term debt S 31.150 Operating lease liabilities 35,863 Accounts payable 89,413 Deferred revenue 39.950 Other current liabilities 386.050 Total current liabilities 582.426 Long-term delt, net 3,004,216 Operating lease liabilities 380,647 Deferred revenue 324,854 Deferred income taxes, net 197,673 Other long-term liabilities 18,218 Total long-term liabilities 3.925,608 Commitments and contingencies (note 16) Stockholders' deficit: Preferred stock, 50.001 par value; 25,000,000 shares authorized: no shares issued and outstanding Common stock, S0.001 par value: 475,000,000 shares authorized: 82.835,830 shares issued and 82,834.836 shares outstanding at December 28, 2019, 82,587,373 shares issued and 82,560,596 shares outstanding at December 29, 2018 83 Additional paid-in capital 561.345 Treasury stock, at cost; 1,000 shares and 26,777 shares at December 28, 2019 and December 29, 2018, respectively (64) Accumulated deficit (1,129.565) Accumulated other comprehensive loss (19.809) Total stockholders' deficit (588,010 Total liabilities and stockholders' deficit 3.920,024 80,037 38,541 389,353 539,581 3,010,626 331.980 204,027 83.164 3.629,797 82 642,017 (1.060) (1,338,709) (15,127) (712.797) 3.456,381 STARBUCKS CORPORATION CONSOLIDATED BALANCE SHEETS in millions, except per share data) Sep 29 Sep 3 21 ASSETS 2.686.65 70.5 879.2 1.5294 4882 5.653.9 220.0 396,0 64317 1,7658 479.6 781.8 3.4908 19219,6 5 8.7563 1815 693.1 1,400 5 1,4628 12,4942 2677 3347 5.9291 1347 4122 1,0422 3,5416 24 1564 Current assets Cash and cash equivalents Short-term investments Accounts receivable, net Inventories Prepaid expenses and other current assets Total current assets Long-term investments Equity investments Property, plant and equipment, net Deferred income taxes, net Other long-term assets Other intangible assets Goodwill TOTAL ASSETS LIABILITIES AND SHAREHOLDERS' EQUITY DEFICIT) Current liabilities Accounts payable Accrued liabilities Accrued payroll and benefits Income taxes payable Stored value card liability and current portion of deferred revenue Current portion of long-term debt Total current liabilities Long-term dicht Deferred revenue Other long-term liabilities Total liabilities Shareholders' equity deficit) Common stock (50.001 par value) - authorised, 2.400 shares, issued and outstanding. 1.184.6 and 1,309,1 shares, respectively Additional paid-in capital Retained earnings (deficit) Accumulated other comprehensive loss Total shareholders equity (deficit) Noncontrolling interests Total equity (deficit) TOTAL LIABILITIES AND SHAREHOLDERS' EQUITY DEFICIT) 1,189.7 5 1.753.7 6616 12917 1.269.0 1.1793 1.7525 6568 1028 6.168.7 11.1670 6,7444 1370.5 25,450.6 349.9 5,6842 9,0902 6,7757 1.4305 22,980.6 12 (5.771.2) (503.3) 411 1,4574 (3303) 1.1695 12 16.231.0) 19.219.6 S 1.175.8 24.1564 s Commodity Price Risk We purchase commodity inputs, primarily coffee, dairy products, diesel, cocoa, sugar and other commodities, that are used in our operations and are subject to price fluctuations that impact our financial results. We use a combination of pricing features embedded within supply contracts, such as fixed-price and price-to-be-fixed contracts for coffee purchases, and financial derivatives to manage our commodity price risk exposure The following table summarizes the potential impact as of September 29, 2019 to Starbucks future net carnings and other comprehensive income ("OCH") from changes in commodity prices. The information provided below relates only to the hedging instruments and does not represent the corresponding changes in the underlying hedged items for millions): Increase (Decrease to Net Earnings Incre/Decreto OCI 10% Increase in 10% Decrease in 10% Increase in 10% Decrease in Underlying Rate Underlying Rate Underlying Rate Cadering Rate Commodity hedges Foreign Currency Exchange Risk The majority of our revenue, expense and capital purchasing activities are transacted in U.S. dollars. However, because a portion of our operations consists of vities outside of the U.S., we have transactions in other currencies, primarily the Chinese renminbi, Japanese yen, Canadian dollar, British pound, South Korean won and euro. To reduce cash flow volatility from foreign currency fluctuations, we enter into derivative instruments to hedge portions of cash flows of anticipated intercompany royalty payments, inventory purchases, intercompany borrowing and lending activities and certain other transactions in currencies other than the functional currency of the entity that enters into the arrangements, as well as the translation risk of certain balance sheet items. See Note 3, Derivative Financial Instruments to the consolidated financial statements included in Item 8 of Part II of this 10-K for further discussion The following table summarizes the potential impact as of September 29, 2019 to Starbucks future net carnings and other comprehensive income from changes in the fair value of these derivative financial instruments due to a change in the value of the US dollar as compared to foreign exchange rates. The information provided below relates only to the hedging instruments and does not represent the corresponding changes in the underlying hedged items (in muillions): Increase (Deca) to Net Earnings Increase Decreases to OCI 104. Increase in 10%. Decrease in 10%. Increase in 10% Decrease in Underlying Rate Underlying Rate Laderlying Rate Underlying Rate Foreign currency hedges 35 (35) 1095 (109) Equity Security Price Risk We have minimal exposure to price fluctuations on equity mutual funds and equity exchange-traded funds within our marketable equity securities portfolio Marketable equity securities are recorded at fair value and approximates a portion of our liability under our Management Deferred Compensation Plan ("MDCP) Gains and losses from the portfolio and the change in our MDCP liability are recorded in our consolidated statements of camings. We performed a sensitivity analysis based on a 10% change in the underlying equity prices of our investments as of September 29, 2019 and determined that such a change would not have a significant impact on the fair value of these instruments. Item 8. Financial Statements and Supplementary Date STARBUCKS CORPORATION CONSOLIDATED STATEMENTS OF EARNINGS (in millions, except per share data) kl. Focal Year Net revenues Company operated stores Licemed stores Other Total net revers Cost of sales Store operating expenses Other operating expenses Depreciation and amortization expenses General and administrative expenses Restructuring and impairments Total operating expenses Income from equity investees Operating income Gain resulting from acquisition of joint venture Net gain resulting from divestiture of certain operations Interest income and other net Interest expense Earnings before income taxes Income tax expense Net cumings including noncontrolling interest Net earningsloss) attributable to controlling interests Net camins attributable to Starbucks Earnings per share busic Famins per share-diluted Weighted average shares outstanding 21.5444 S 2.875.0 2.089.2 26,5086 8.526.9 10,4936 371.0 1,3773 1.8241 1358 22,728.7 1980 4,077.9 17,650.7 23550 2.381.1 22.386,8 7,0658 8,486.4 $18.0 1,0114 1.408.4 1535 19,6903 $ 2,652.2 2.377.0 24,719.5 7.930,7 9,4722 5549 1.247.0 1.708.2 2244 21,1374 301.2 3.8833 1,3764 499,2 1914 (170.3) 5,7800 1.262.0 4.518.0 10.3) 4,51815 1275 324 18,643.5 3914 4.1347 6228 935 96.5 (331,0) 4.4662 871.6 3.594.6 1461 3.399,25 2.955 2.925 IRIA 192.5) 4.3173 1,4326 2.84.9 02 2884.7 1.99 1.97 S S Diluted 1.233 1.327 16 1,493 1.4613 See Nows to Consolidated Financial Statement DUNKIN BRANDS GROUP, INC. AND SUBSIDIARIES Consolidated Balance Sheets (In thousands, except share data) Beber 2013 December 29 2012 S 621.152 85,644 76,019 57.174 16,701 50,611 907.301 223.120 371,264 154,812 888.286 1,302,721 72.520 3.920 024 517.594 79,008 75,963 64.412 27.005 49,491 813.473 209,202 146,395 888.265 1.334,767 64,479 3 456 581 $ 31.650 Assets Current sets Cash and cash equivalents Restricted cash Accounts receivable, net Notes and other receivables, net Prepaid income taxes Prepaid expenses and other current assets Total current assets Property, equipment, and software, net Operating lease assets Equity method investments Goodwill Other intangible assets, net Other assets Total assets Liabilities and Stockholders' Deficit Current liabilities Current portion of long-term debt Operating lease liabilities Accounts payable Deferred revenue Other current liabilities Total current liabilities Long-term debt, net Operating lease liabilities Deferred revenue Deferred income taxes, net Other long-term liabilities Total long-term liabilities Commitments and contingencies (note 16) Stockholders' deficit: Preferred stock, 50.001 par value: 25,000,000 shares authorized: no share issued and outstanding Common stock, 50.001 par value; 475,000,000 shares authorized 2.835 830 shares issued and 82.834 830 shares outstanding at December 28, 2019. 2.587,373 shares issued and 82,560,5% shares outstanding at December 29, 2018 Additional paid in capital Treasury stock, at cost: 1,000 shares and 26,777 stures at December 28, 2019 and December 29, 2018, respectively Accumulated deficit Accumulated other comprehensive loss Total stockholders' deficit Total liabilities and stockholders' deficit 31,150 35,863 89.413 39.950 386.050 582.426 3.004.216 380,647 324.854 197,673 18.21% 3.925,608 80,037 38,541 389,353 $39,581 3,010,626 331.980 204027 83.164 3.629,797 1 83 561,345 2 542.017 (1,129,565) (19.809) (583 010) $ 3.920,024 (1.060) (1.338,709) (15.127 712.797) 3.456,581 December 29 517,594 79,008 75,963 64.412 27,005 49,491 813.473 209,202 146,395 888.265 1,334.767 64,479 3.456,581 31,650 DUNKIN' BRANDS GROUP, INC. AND SUBSIDIARIES Consolidated Balance Sheets (In thousands, except share data) December 2019 Assets Current assets: Cash and cash equivalents 621.152 Restricted cash 85.614 Accounts receivable, net 76,019 Notes and other receivables, net 57.174 Prepaid income taxes 16,701 Prepaid expenses and other current assets 50.611 Total current assets 907.301 Property, equipment, and software, net 223.120 Operating lease assets 371.264 Equity method investments 154,812 Goodwill 888.286 Other intangible assets, net 1,302.721 Other assets 72.520 Total assets 3.920,024 Liabilities and Stockholders' Deficit Current liabilities: Current portion of long-term debt S 31.150 Operating lease liabilities 35,863 Accounts payable 89,413 Deferred revenue 39.950 Other current liabilities 386.050 Total current liabilities 582.426 Long-term delt, net 3,004,216 Operating lease liabilities 380,647 Deferred revenue 324,854 Deferred income taxes, net 197,673 Other long-term liabilities 18,218 Total long-term liabilities 3.925,608 Commitments and contingencies (note 16) Stockholders' deficit: Preferred stock, 50.001 par value; 25,000,000 shares authorized: no shares issued and outstanding Common stock, S0.001 par value: 475,000,000 shares authorized: 82.835,830 shares issued and 82,834.836 shares outstanding at December 28, 2019, 82,587,373 shares issued and 82,560,596 shares outstanding at December 29, 2018 83 Additional paid-in capital 561.345 Treasury stock, at cost; 1,000 shares and 26,777 shares at December 28, 2019 and December 29, 2018, respectively (64) Accumulated deficit (1,129.565) Accumulated other comprehensive loss (19.809) Total stockholders' deficit (588,010 Total liabilities and stockholders' deficit 3.920,024 80,037 38,541 389,353 539,581 3,010,626 331.980 204,027 83.164 3.629,797 82 642,017 (1.060) (1,338,709) (15,127) (712.797) 3.456,381 STARBUCKS CORPORATION CONSOLIDATED BALANCE SHEETS in millions, except per share data) Sep 29 Sep 3 21 ASSETS 2.686.65 70.5 879.2 1.5294 4882 5.653.9 220.0 396,0 64317 1,7658 479.6 781.8 3.4908 19219,6 5 8.7563 1815 693.1 1,400 5 1,4628 12,4942 2677 3347 5.9291 1347 4122 1,0422 3,5416 24 1564 Current assets Cash and cash equivalents Short-term investments Accounts receivable, net Inventories Prepaid expenses and other current assets Total current assets Long-term investments Equity investments Property, plant and equipment, net Deferred income taxes, net Other long-term assets Other intangible assets Goodwill TOTAL ASSETS LIABILITIES AND SHAREHOLDERS' EQUITY DEFICIT) Current liabilities Accounts payable Accrued liabilities Accrued payroll and benefits Income taxes payable Stored value card liability and current portion of deferred revenue Current portion of long-term debt Total current liabilities Long-term dicht Deferred revenue Other long-term liabilities Total liabilities Shareholders' equity deficit) Common stock (50.001 par value) - authorised, 2.400 shares, issued and outstanding. 1.184.6 and 1,309,1 shares, respectively Additional paid-in capital Retained earnings (deficit) Accumulated other comprehensive loss Total shareholders equity (deficit) Noncontrolling interests Total equity (deficit) TOTAL LIABILITIES AND SHAREHOLDERS' EQUITY DEFICIT) 1,189.7 5 1.753.7 6616 12917 1.269.0 1.1793 1.7525 6568 1028 6.168.7 11.1670 6,7444 1370.5 25,450.6 349.9 5,6842 9,0902 6,7757 1.4305 22,980.6 12 (5.771.2) (503.3) 411 1,4574 (3303) 1.1695 12 16.231.0) 19.219.6 S 1.175.8 24.1564 s Commodity Price Risk We purchase commodity inputs, primarily coffee, dairy products, diesel, cocoa, sugar and other commodities, that are used in our operations and are subject to price fluctuations that impact our financial results. We use a combination of pricing features embedded within supply contracts, such as fixed-price and price-to-be-fixed contracts for coffee purchases, and financial derivatives to manage our commodity price risk exposure The following table summarizes the potential impact as of September 29, 2019 to Starbucks future net carnings and other comprehensive income ("OCH") from changes in commodity prices. The information provided below relates only to the hedging instruments and does not represent the corresponding changes in the underlying hedged items for millions): Increase (Decrease to Net Earnings Incre/Decreto OCI 10% Increase in 10% Decrease in 10% Increase in 10% Decrease in Underlying Rate Underlying Rate Underlying Rate Cadering Rate Commodity hedges Foreign Currency Exchange Risk The majority of our revenue, expense and capital purchasing activities are transacted in U.S. dollars. However, because a portion of our operations consists of vities outside of the U.S., we have transactions in other currencies, primarily the Chinese renminbi, Japanese yen, Canadian dollar, British pound, South Korean won and euro. To reduce cash flow volatility from foreign currency fluctuations, we enter into derivative instruments to hedge portions of cash flows of anticipated intercompany royalty payments, inventory purchases, intercompany borrowing and lending activities and certain other transactions in currencies other than the functional currency of the entity that enters into the arrangements, as well as the translation risk of certain balance sheet items. See Note 3, Derivative Financial Instruments to the consolidated financial statements included in Item 8 of Part II of this 10-K for further discussion The following table summarizes the potential impact as of September 29, 2019 to Starbucks future net carnings and other comprehensive income from changes in the fair value of these derivative financial instruments due to a change in the value of the US dollar as compared to foreign exchange rates. The information provided below relates only to the hedging instruments and does not represent the corresponding changes in the underlying hedged items (in muillions): Increase (Deca) to Net Earnings Increase Decreases to OCI 104. Increase in 10%. Decrease in 10%. Increase in 10% Decrease in Underlying Rate Underlying Rate Laderlying Rate Underlying Rate Foreign currency hedges 35 (35) 1095 (109) Equity Security Price Risk We have minimal exposure to price fluctuations on equity mutual funds and equity exchange-traded funds within our marketable equity securities portfolio Marketable equity securities are recorded at fair value and approximates a portion of our liability under our Management Deferred Compensation Plan ("MDCP) Gains and losses from the portfolio and the change in our MDCP liability are recorded in our consolidated statements of camings. We performed a sensitivity analysis based on a 10% change in the underlying equity prices of our investments as of September 29, 2019 and determined that such a change would not have a significant impact on the fair value of these instruments