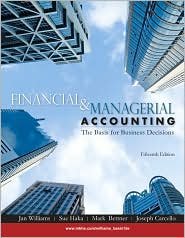
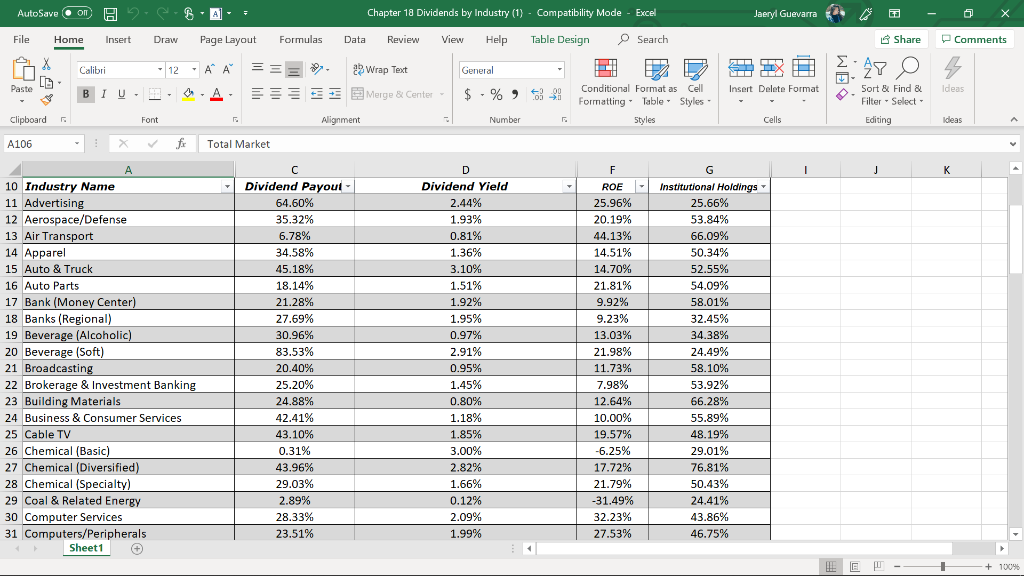
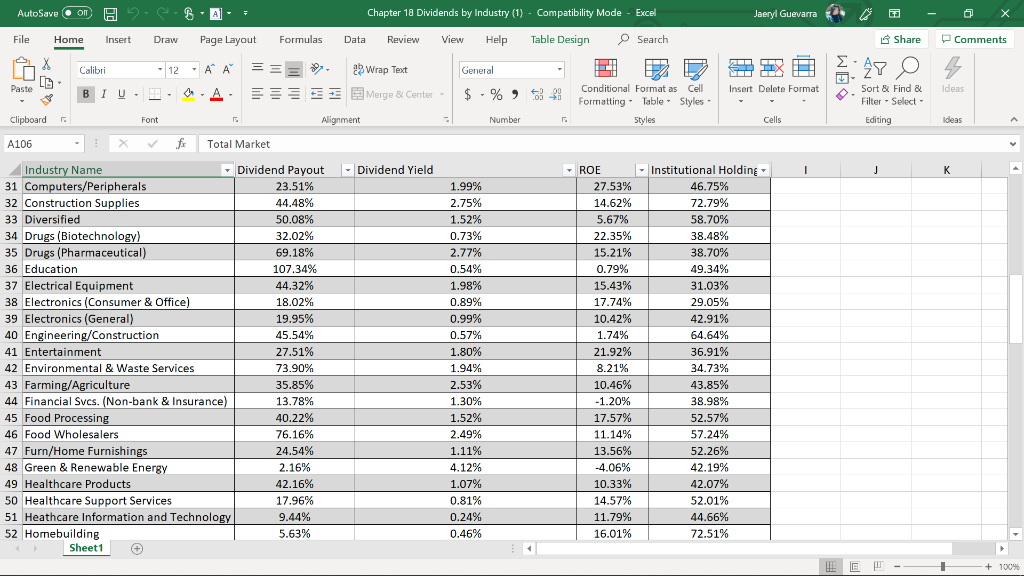
Select two industries and explain the variance in their dividend payout ratio.
Your explanation should include the relevant factors that are specific/unique to each industry which thoroughly explain the variance.
Once an industry has been submitted by a student it cannot be used again by another student.
Secondly, as an investor, which industry (payout ratio) would you prefer, explain why.
Chapter 18 Dividends by Industry (1} - Compatibility Mode Excel AutoSave on Jaeryl Guevarra OSearch Comments File Formulas Review View Help Table Design Share Home Insert Draw Page Layaut Data 12 ab Wrap Text A A General Calibri PacteLB Conditional Format as Styles Sort & Find & Filter Select Ideas Cell Insert Delete Format A Merge & Center % BIU Formatting Table Editing Clipboard Alignment Number Styles Cells Ideas Font A106 Total Market D F G J K Dividend Payout- Dividend Yield 10 Industry Name ROE Institutional Holdings 64.60% 25.66% 11 Advertising 2.44% 25.96% 12 Aerospace/Defense 35.32 % 20.19% 53.84% 1.93% 44.13 % 6.78% 0,81% 66.09% 13 Air Transport 14 Apparel 34.58% 1.36% 14.51 % 50.34% 45.18 % 18.14 % 3.10% 14.70% 52.55% 15 Auto & Truck 21.81 % 54.09% 16 Auto Parts 1.51% 17 Bank (Money Center) 18 Banks (Regional) 19 Beverage (Alcoholic) 20 Beverage (Soft) 21.28% 1.92% 9,92% 58.01% 27.69 % 9.23% 1.95% 32.45% 30.96% 0.97% 13.03% 34.38% 2.91% 21.98 % 24,49% 83.53% 21 Broadcati dcasting 22 Brokerage & Investment Banking 20.40% 11.73% 0.95% 58.10% 25.20% 1.45% 53.92% 7,98% 23 Building Materials 24 Business & Consumer Services 24.88% 0.80% 12.64% 66.28% 42.41% 1.18% 10.00 % 55.89% 25 Cable TV 43.10% 1.85% 19.57% 48.19 % 26 Chemical (Basic) 27 Chemical (Diversified) 28 Chemical (Specialty) 29 Coal & Related Energy 30 Computer Services 31 Computers/Peripherals 0.31% 3.00% -6.25% 29.01% 43.96% 2.82% 17.72% 76.81% 29.03% 1,66% 21,79% 50,43% 2.89% -31.49 % 0.12% 24.41% 28.33% 2,09% 32.23% 43.86% 23.51% 27.53% 46.75% 1.99% Sheet1 4 + 100% WE Chapter 18 Dividends by Industry (1} - Compatibility Mode Excel AutoSave on Jaeryl Guevarra OSearch Comments File Formulas Review View Help Table Design Share Home Insert Draw Page Layaut Data 12 ab Wrap Text A A General Calibri PacteLB Conditional Format as Sort & Find & Filter Select Ideas Cell Insert Delete Format A Merge & Center BIU % Formatting Table Styles Editing Clipboard Alignment Number Styles Cells Ideas Font A106 Total Market Dividend Payout Institutional Holding Dividend Yield Industry Name K ROE J 31 Computers/Peripherals 32 Construction Supplies 23.51% 46.75% 1.99% 27.53% 44.48% 2.75% 14.62% 72.79% 33 Diversified 50.08% 1.52% 5.67% 58.70% 34 Drugs (Biotechnology) 35 Drugs (Pharmaceutical) 32.02% 0.73% 22.35% 38.48% 38.70 % 69.18% 2.77% 15.21% 107.34% 0.54% 0.79% 49.34% 36 Education 15.43 % 37 Electrical Equipment 38 Electronics (Consumer & Office) 39 Electronics (General) 31.03 % 44.32% 1.98% 18.02% .89% 17.74% 29.05% 19.95% 10.42 % 42.91% 0.99% 40 Engineering/Construction 45.54% 1.74% 64.64% 0.57% 41 Entertainment 42 Environmental & Waste Services 1.80 % 27.51% 36.91 % 21.92% 73.90% 34.73% 1.94% 8.21% 35.85% 43.85% 38 98% 43 Farming/Agriculture 44 Financial Svcs. (Non-bank & Insurance) 45 Food Processing 46 Food Wholesalers 47 Furn/Home Furnishings 48 Green & Renewable Energy 2.53% 10.46% 1.30 % 13.78% -1.20% 40.22% 1.52% 17.57% 52.57% 11.14 % 76.16% 2.49% 57.24% 24.54% 1.11% 13.56% 52.26% 4.12% 2.16% -4.06% 42.19% 49 Healthcare Products 42.16% 1.07% 10.33% 42.07% 50 Healthcare Support Services 51 Heathcare Information and Technology 17.96% 0.81% 14.57% 52.01% 9.44% 0.24% 11.79% 44,66% 5.63% 52 Homebuilding 0.46% 16.01% 72.51% Sheet1 + 100% Chapter 18 Dividends by Industry (1} - Compatibility Mode Excel AutoSave on Jaeryl Guevarra OSearch Comments File Formulas Review View Help Table Design Share Home Insert Draw Page Layaut Data 12 ab Wrap Text A A General Calibri Conditional Format as Sort & Find & Filter Select Ideas Paste Cell Insert Delete Format A Merge & Center BIU Formatting Table Styles Editing Clipboard Alignment Number Styles Cells Ideas Font A106 Total Market Dividend Payout Institutional Holding Industry Name 52 Homebuilding Dividend Yield K ROE J 5.63% 0.46% 16.01% 72.51% 66.92% 53 Hospitals/Healthcare Facilities 54 Hotel/Gaming 110.47% 3.72% 9.98% 42.88% 47.47% 2.45% 20.35 % 37.10 % 55 Household Products 91.91% 2.54% 13.46% 56 Information Services 57 Insurance (General) 58 Insurance (Life) 66.28% 23.81% 0.80% 23.78% 27.93% 1.49% 4.67% 63.97% 27.26 % 60.19 % 2.52% 8.68% 11.91 % 59 Insurance (Prop/Cas.) 60 Investments & Asset Management 24.36% 1.97% 61.09% 63.04 % 11.18 % 45.01% 3.85% 61 Machinery 62 Metals & Mining 63 Office Equipment & Services 64 Oil/Gas (Integrated) 65 Oil/Gas (Production and Exploration) 37.58% 12.76% 65.09% 1.84% 2.71% -23.49% 0.21% 20.07% 33.11 % 29.36% 2.62% 60.70% 99.94% 4,08% 5,84% 55.66% 0.49% 3.10% -27.53% 35.56% 66 Oil/Gas Distribution 225.73% 7.31% 7.52% 43.75% 67 Oilfield Svcs/Equip. 68 Packaging & Container 69 Paper/Forest Products 51.81% 2.91% 8.26% 51.89% 35.85% 1.47% 16.99% 76.02 % 113.08 % 2.96% 6.34% 69.94% 68.68% 3.48% 8.55% 62.08% 70 Power 71 Precious Metals 0.24% 112.88 % 0.90% -4.40% 18.02% 72 Publshing & Newspapers 73 R.E.I.T 2,98% 4.18% 59.52% 137.82% 7,48% 4.28% 73.54% Sheet1 + 100%