

Answered step by step
Verified Expert Solution
Question
1 Approved Answer
Selected comparative financial data (in thousands, except for share price) for Cineplex Inc. are shown below. 2017 2016 Revenue $1,555,067 $1,478,326 Interest expense 22,734 18,936
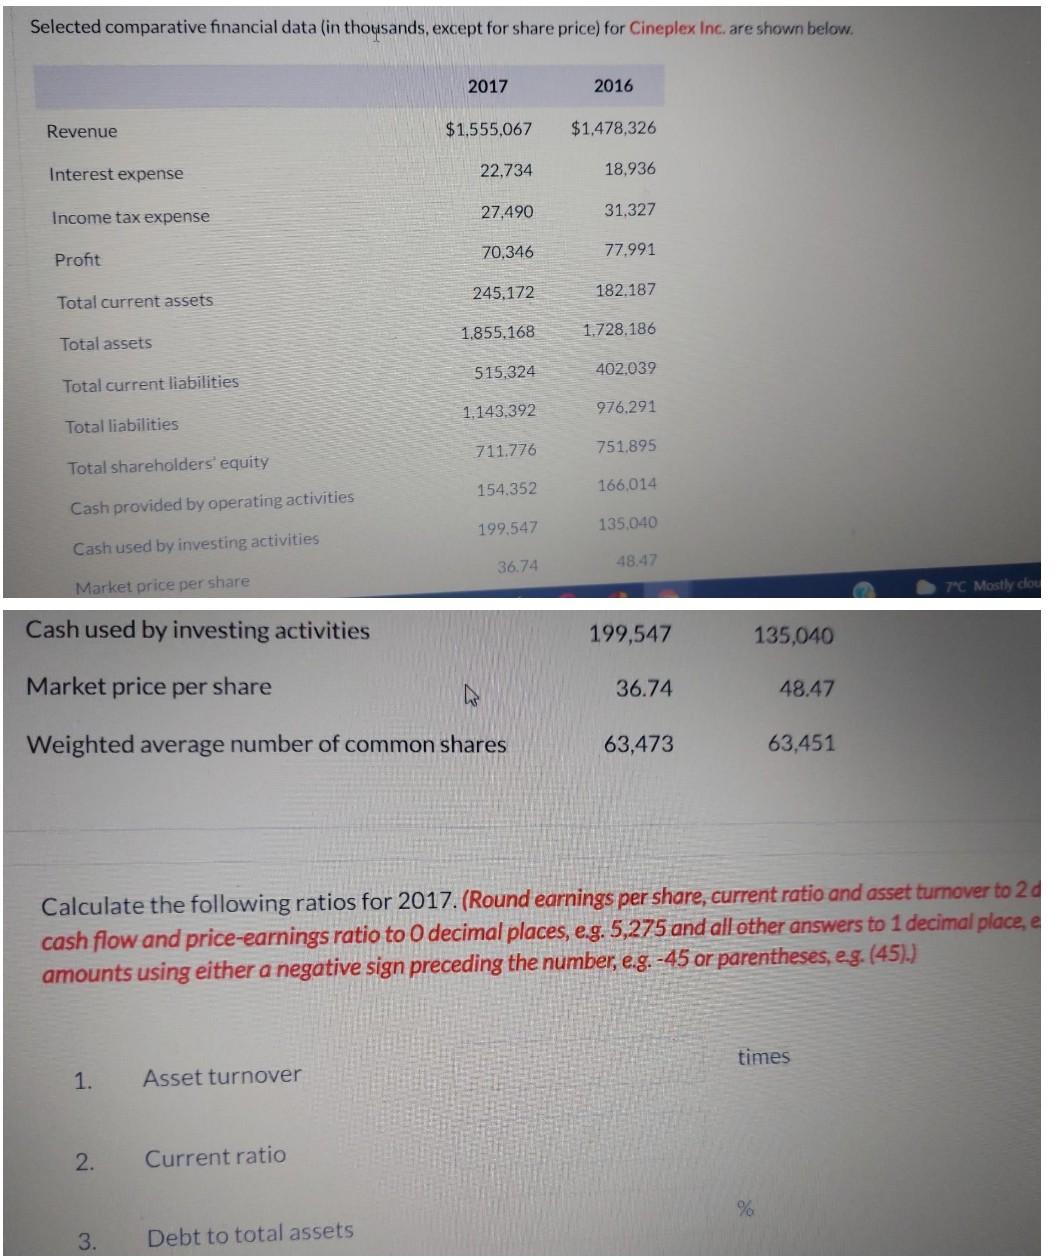
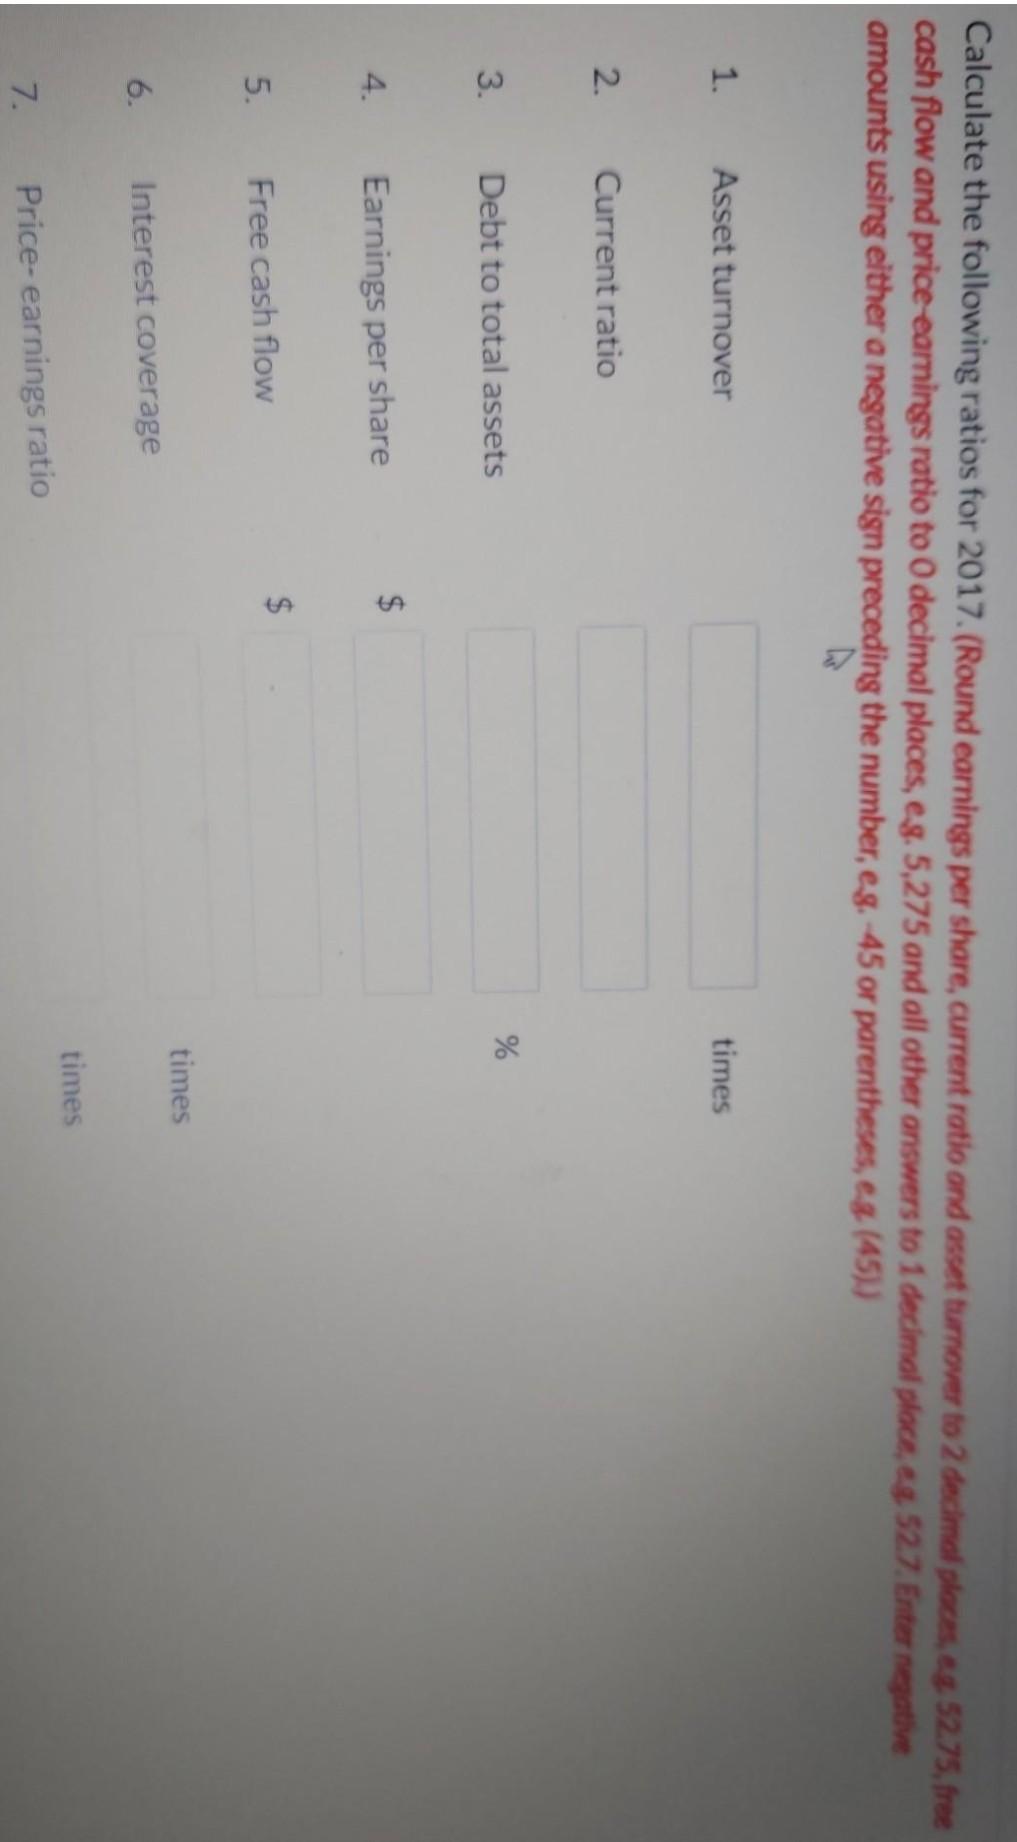
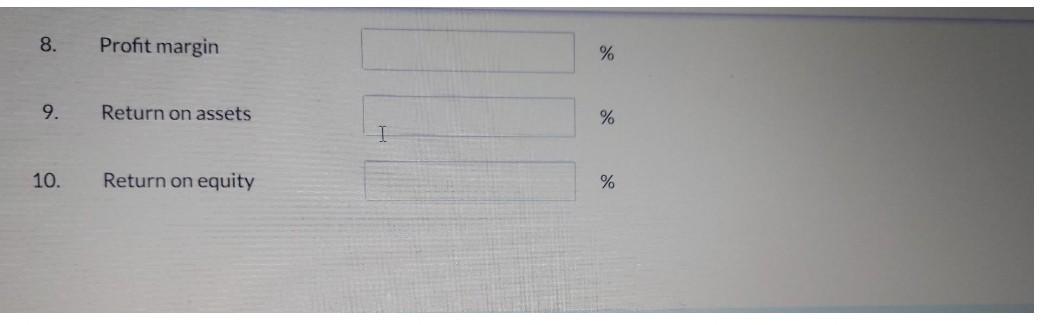
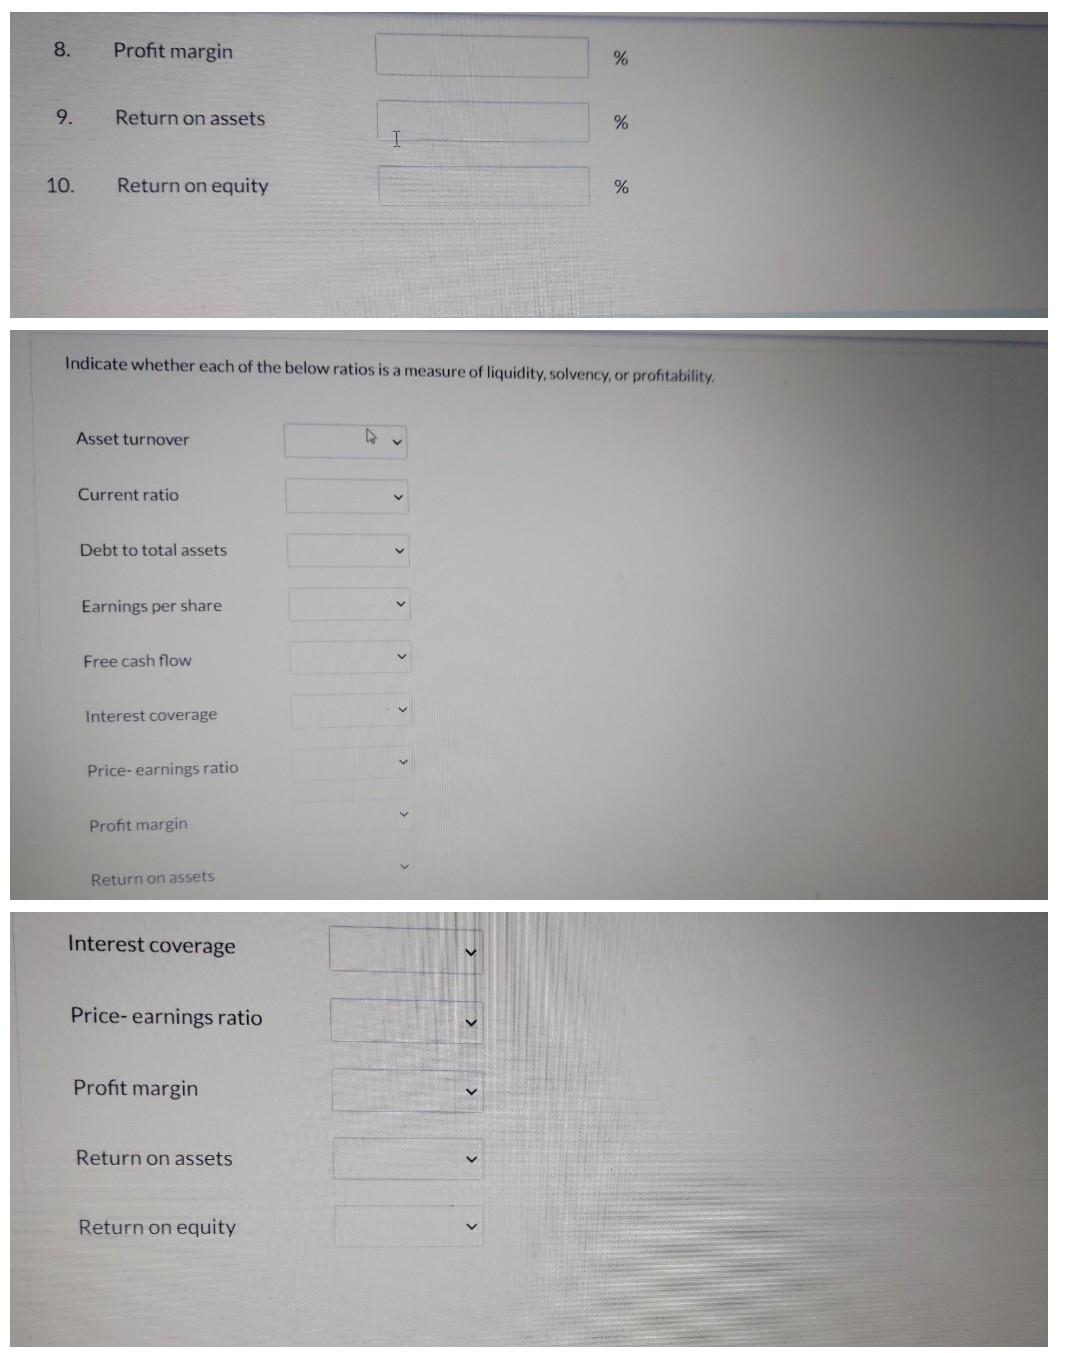
Selected comparative financial data (in thousands, except for share price) for Cineplex Inc. are shown below. 2017 2016 Revenue $1,555,067 $1,478,326 Interest expense 22,734 18,936 Income tax expense 27,490 31.327 Profit 70,346 77.991 245,172 182.187 Total current assets 1.855.168 1.728,186 Total assets 515,324 402,039 Total current liabilities 1.143.392 976,291 Total liabilities 711.776 751.895 Total shareholders' equity 154.352 166,014 Cash provided by operating activities 199.547 135,040 Cash used by investing activities 36.74 48.47 Market price per share Mostly do Cash used by investing activities 199,547 135,040 Market price per share 36.74 48.47 Weighted average number of common shares 63,473 63,451 Calculate the following ratios for 2017.(Round earnings per share, current ratio and asset turnover to 24 cash flow and price-earnings ratio to 0 decimal places, e.g. 5,275 and all other answers to 1 decimal place, amounts using either a negative sign preceding the number, e.g. -45 or parentheses, eg. (45).) times 1. Asset turnover 2. Current ratio % 3. Debt to total assets Calculate the following ratios for 2017. (Round earnings per share, current ratio and asset turnover to 2 decimal places, ag. 52.75, free cash flow and price earnings ratio to 0 decimal places, eg. 5,275 and all other answers to 1 decimal place, eg. 52.7. Enter negative amounts using either a negative sign preceding the number, eg.-45 or parentheses, eg (451) 1. Asset turnover times 2. Current ratio % 3. Debt to total assets $ 4. Earnings per share 5. Free cash flow $ times 6. Interest coverage times 7. Price- earnings ratio 8. Profit margin % 9. Return on assets % I 10. Return on equity % 8. Profit margin % 9. Return on assets % I 10. Return on equity % Indicate whether each of the below ratios is a measure of liquidity, solvency, or profitability. Asset turnover Current ratio Debt to total assets Earnings per share Free cash flow Interest coverage Price-earnings ratio Profit margin Return on assets Interest coverage Price- earnings ratio Profit margin Return on assets Return on equity
Step by Step Solution
There are 3 Steps involved in it
Step: 1

Get Instant Access to Expert-Tailored Solutions
See step-by-step solutions with expert insights and AI powered tools for academic success
Step: 2

Step: 3
Ace Your Homework with AI
Get the answers you need in no time with our AI-driven, step-by-step assistance
Get Started
Financial Accounting
Authors: John Hoggett, Lew Edwards, John Medlin, Keryn Chalmers, Jodie Maxfield, Andreas Hellmann, Claire Beattie
9th Edition
1118608208, 978-1118608203