

Question
Selected comparative financial statements of Haroun Company follow. HAROUN COMPANY Comparative Income Statements For Years Ended December 31, 20172011 ($ thousands) 2017 2016 2015 2014
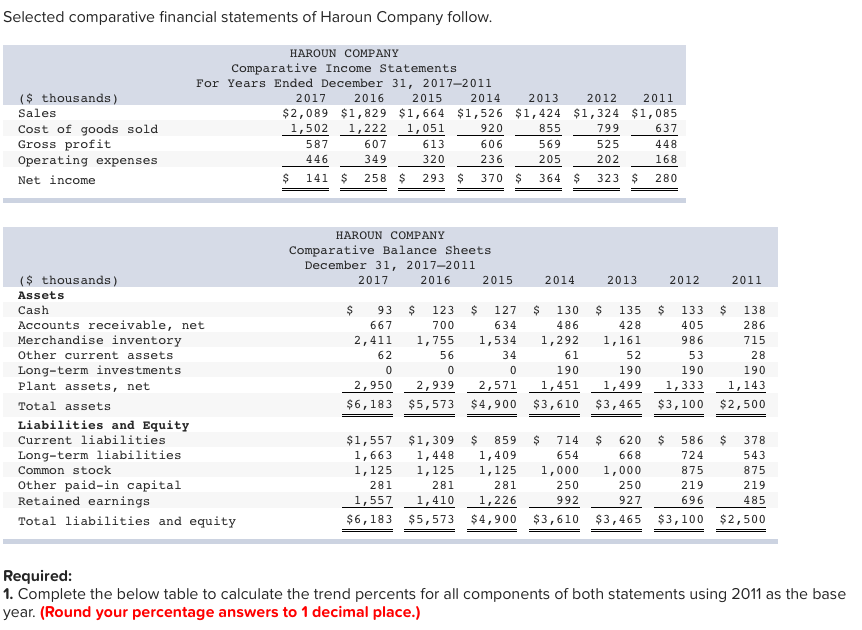
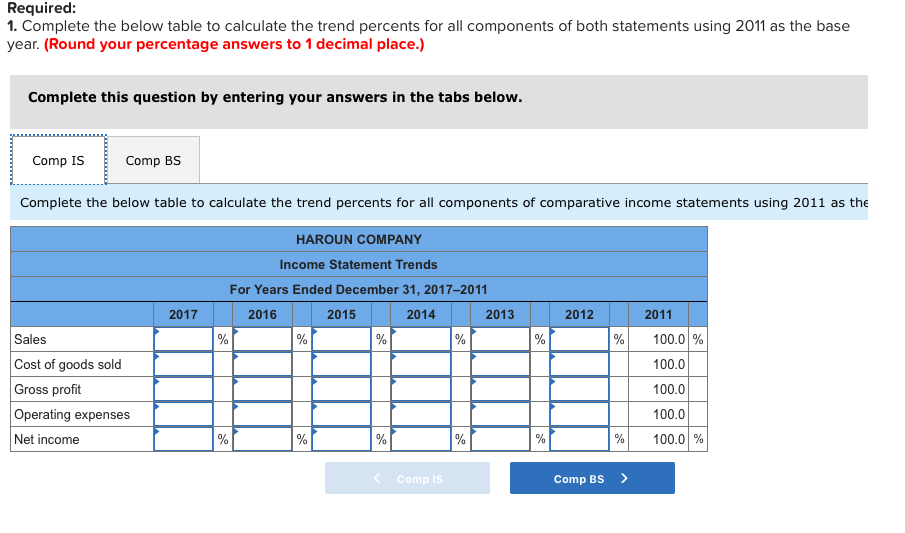
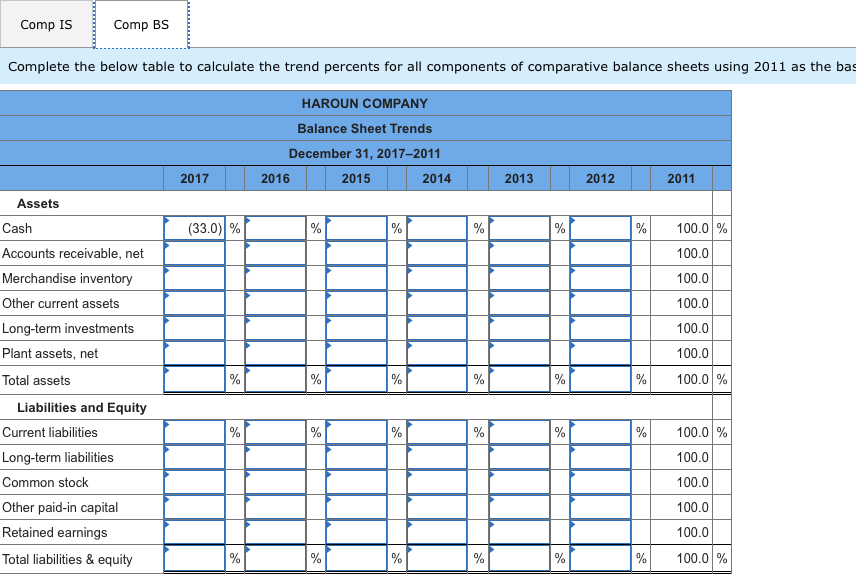 Selected comparative financial statements of Haroun Company follow. HAROUN COMPANY Comparative Income Statements For Years Ended December 31, 20172011 ($ thousands) 2017 2016 2015 2014 2013 2012 2011 Sales $ 2,089 $ 1,829 $ 1,664 $ 1,526 $ 1,424 $ 1,324 $ 1,085 Cost of goods sold 1,502 1,222 1,051 920 855 799 637 Gross profit 587 607 613 606 569 525 448 Operating expenses 446 349 320 236 205 202 168 Net income $ 141 $ 258 $ 293 $ 370 $ 364 $ 323 $ 280 HAROUN COMPANY Comparative Balance Sheets December 31, 20172011 ($ thousands) 2017 2016 2015 2014 2013 2012 2011 Assets Cash $ 93 $ 123 $ 127 $ 130 $ 135 $ 133 $ 138 Accounts receivable, net 667 700 634 486 428 405 286 Merchandise inventory 2,411 1,755 1,534 1,292 1,161 986 715 Other current assets 62 56 34 61 52 53 28 Long-term investments 0 0 0 190 190 190 190 Plant assets, net 2,950 2,939 2,571 1,451 1,499 1,333 1,143 Total assets $ 6,183 $ 5,573 $ 4,900 $ 3,610 $ 3,465 $ 3,100 $ 2,500 Liabilities and Equity Current liabilities $ 1,557 $ 1,309 $ 859 $ 714 $ 620 $ 586 $ 378 Long-term liabilities 1,663 1,448 1,409 654 668 724 543 Common stock 1,125 1,125 1,125 1,000 1,000 875 875 Other paid-in capital 281 281 281 250 250 219 219 Retained earnings 1,557 1,410 1,226 992 927 696 485 Total liabilities and equity $ 6,183 $ 5,573 $ 4,900 $ 3,610 $ 3,465 $ 3,100 $ 2,500 Required: 1. Complete the below table to calculate the trend percents for all components of both statements using 2011 as the base year. (Round your percentage answers to 1 decimal place.)
Step by Step Solution
There are 3 Steps involved in it
Step: 1

Get Instant Access to Expert-Tailored Solutions
See step-by-step solutions with expert insights and AI powered tools for academic success
Step: 2

Step: 3
Ace Your Homework with AI
Get the answers you need in no time with our AI-driven, step-by-step assistance
Get Started
The Budget Bible Budgeting Made Simple
Authors: Jessica Charise Brant, Adrienne Homet Hand
979-8218059880