Answered step by step
Verified Expert Solution
Question
1 Approved Answer
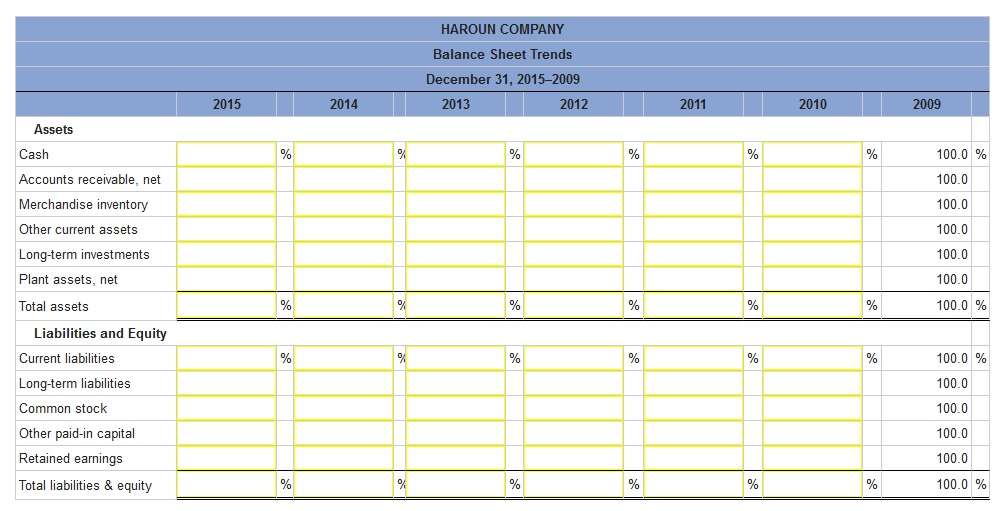
Selected comparative financial statements of Haroun Company follow. Required: 1. Complete the below table to calculate the trend percents for all components of both statements
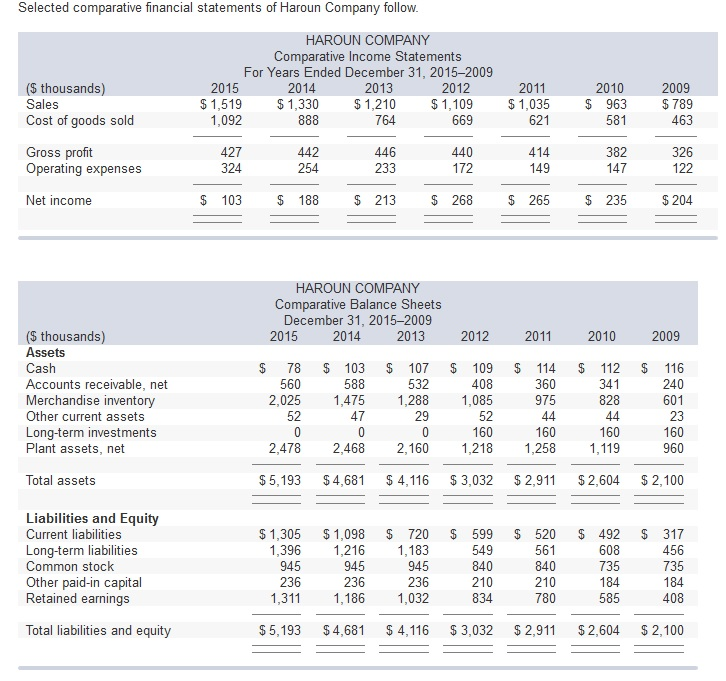
Selected comparative financial statements of Haroun Company follow.
Required:
1. Complete the below table to calculate the trend percents for all components of both statements using 2009 as the base year. (Round your percentage answers to 1 decimal place.)
Selected comparative financial statements of Haroun Company follow HAROUN COMPANY Comparative Income Statements For Years Ended December 31, 2015-2009 (S thousands) Cost of goods sold Gross profit 2015 $ 1,519 1,092 2014 $1,330 2013 $1,210 764 2012 $1,109 669 2011 $ 1,035 2010 S 963 581 2009 $789 427 324 414 149 442 440 172 382 446 233 326 122 Operating expenses Net income $ 103 $188 $ 213 $ 268 S 265 $ 235 $ 204 HAROUN COMPANY Comparative Balance Sheets December 31, 2015-2009 2013 2011 2010 S thousands) Assets 2015 2014 2012 2009 $ 78 $103 $ 107 $ 109 S 114 S 112 S 116 240 601 408 2,025 1,475 1,288 1,085 360 975 588 Accounts receivable, net Merchandise inventory Other current assets Long-term investments Plant assets, net 560 532 341 828 29 160 160 160 2,478 2,468 2,160 1,218 1,2581,119 160 960 Total assets $5,193 $4,681 $ 4,116 $3,032 $2,911$ 2,604 $ 2,100 Liabilities and Equity Current liabilities Long-term liabilities Common stock Other paid-in capital Retained earnings $1,305 $1,098 $ 720 $ 599 $ 520$ 492 $ 317 456 735 549 840 561 840 608 735 1,396 1,216 1,183 236 236 236 1,311 1,186 1,032 834 408 Total liabilities and equity $5,193 $4,681 $4,116 $3,032 2,911 $ 2,604 $ 2,100Step by Step Solution
There are 3 Steps involved in it
Step: 1
Get Instant Access to Expert-Tailored Solutions
See step-by-step solutions with expert insights and AI powered tools for academic success
Step: 2
Step: 3
Ace Your Homework with AI
Get the answers you need in no time with our AI-driven, step-by-step assistance
Get Started