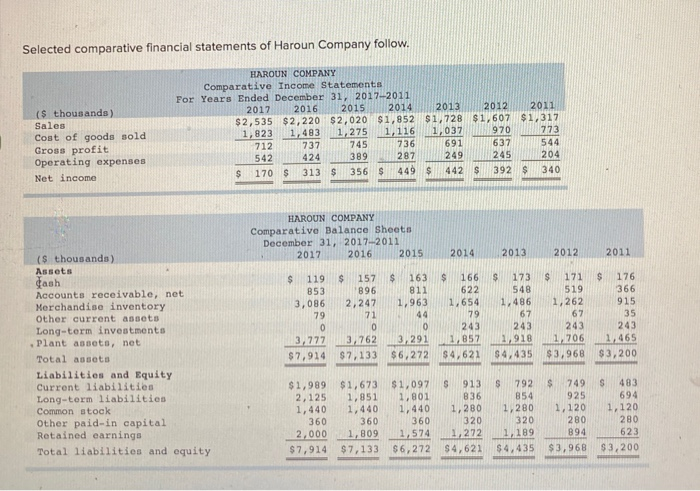
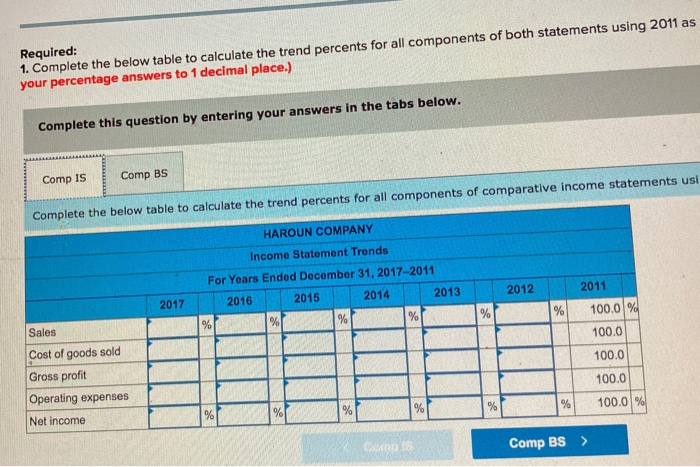
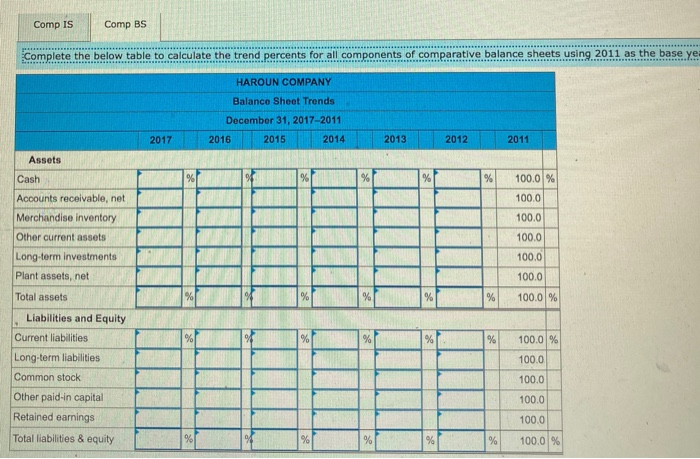
Selected comparative financial statements of Haroun Company follow. ($ thousands) Sales Cost of goods sold Gross profit Operating expenses Net income HAROUN COMPANY Comparative Income Statements For Years Ended December 31, 2017-2011 2017 2016 2015 2014 2013 2012 2011 $2,535 $2,220 $2,020 $1,852 $1,728 $1,607 $1,317 1,823 1,483 1,275 1,116 1,037 970 773 712 737 745 736 691 637 544 542 424 389 287 249 245 204 $ 170 $ 313 $ 356 $ 449 $ 442 S 392 $ 340 HAROUN COMPANY Comparative Balance Sheets December 31, 2017-2011 2017 2016 2015 2014 2013 2012 2011 ($ thousands) Assets dash Accounts receivable, net Merchandise inventory Other current assets Long-term investments Plant assets, net Total assets Liabilities and Equity Current liabilities Long-term liabilities Common stock Other paid-in capital Retained earnings Total liabilities and equity $ 119 853 3,086 79 0 3,777 $ 7,914 $ 157 $ 163 896 811 2,247 1,963 71 44 0 0 3,762 3,291 $7,133 $6,272 $ 166 622 1,654 79 243 1,857 $4,621 $ 173 548 1,486 67 243 1,918 $4,435 $ 171 519 1,262 67 243 1,706 $3,968 $ 176 366 915 35 243 1,465 $3,200 $1,989 $1,673 $1,097 S 913 S 792 $ 749 2,125 1,851 1,801 836 854 925 1,440 1,440 1,440 1,280 1,280 1,120 360 360 320 320 280 2,000 1,809 1,574 1,272 1,189 894 $7,914 $7,133 S6,272 S4,621 $4,435 $3,968 S 483 694 1,120 280 623 $3,200 360 Required: 1. Complete the below table to calculate the trend percents for all components of both statements using 2011 as your percentage answers to 1 decimal place.) Complete this question by entering your answers in the tabs below. Comp IS Comp BS Complete the below table to calculate the trend percents for all components of comparative Income statements usi HAROUN COMPANY Income Statement Trends For Years Ended December 31, 2017-2011 2016 2015 2014 2013 2012 2011 2017 100.0 % % % % % % % Sales 100.0 100.0 Cost of goods sold Gross profit Operating expenses 100.0 % % 100.0 % % % % % Net income CS 18 Comp BS > Comp IS Comp BS Complete the below table to calculate the trend percents for all components of comparative balance sheets using 2011 as the base ye HAROUN COMPANY Balance Sheet Trends December 31, 2017-2011 2017 2016 2015 2014 2013 2012 2011 Assets Cash % % % % 100.0 % 100.0 100.0 Accounts receivable, net Merchandise inventory Other current assets Long-term investments 100.0 100.0 Plant assets, net 100.0 Total assets % % % % 100.0 % Liabilities and Equity Current liabilities Long-term liabilities % % % % 100.0 % 100.0 Common stock 100.0 100.0 Other paid-in capital Retained earnings Total liabilities & equity 100.0 % % 100.0 %