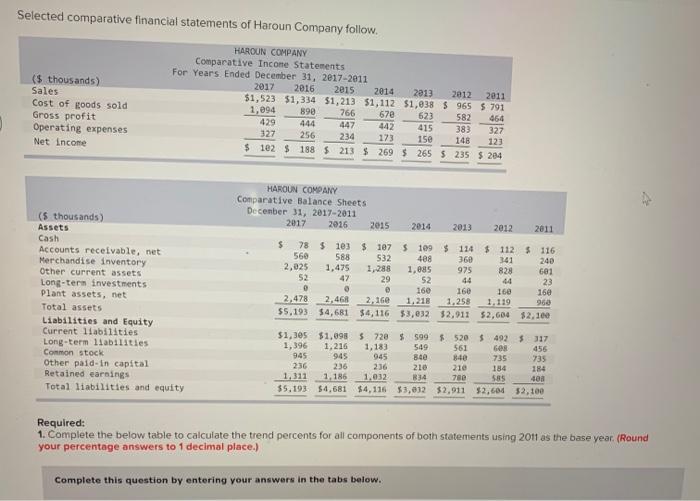
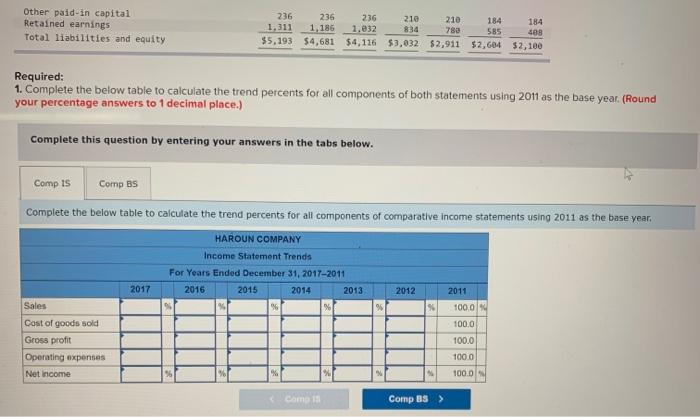
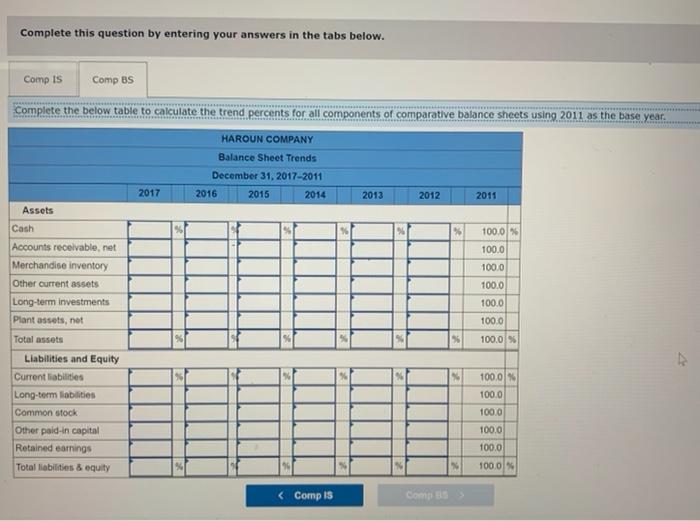
Selected comparative financial statements of Haroun Company follow. ($ thousands) Sales Cost of goods sold Gross profit Operating expenses Net Income HAROUN COMPANY Comparative Income Statements For Years Ended December 31, 2017-2011 2017 2016 2015 2014 2013 2012 2011 $1,523 $1,334 $1,213 $1,112 $1,038 $ 965 $ 791 1,094 890 766 67e 623 582 464 429 444 447 442 415 382 327 327 256 173 15e 148 123 $ 1825 188 $ 213 $ 269 $ 265 $ 235 5 204 234 HAROUN COMPANY Comparative Balance Sheets December 31, 2017-2011 2017 2016 2015 2014 2013 2012 2011 975 (5 thousands) Assets Cash Accounts receivable, net Merchandise inventory Other current assets Long-term investments Plant assets, net Total assets Liabilities and Equity Current liabilities Long-term liabilities Common stock Other paid in capital Retained earnings Total liabilities and equity S 78 $ 10 $ 107 $ 109 $ 114 $1125 116 560 588 532 488 360 341 240 2,025 1.475 1.288 1,085 828 601 52 29 52 44 44 23 0 160 160 160 168 2,478 2,468 2. 160 1,218 1.258 1.119 960 $5.193 $4,681 $4,116 $3,032 $2,911 $2,604 $2,100 $1,305 $1,098 $728 $599 $520 $ 492 $317 1,396 1,216 1,183 549 561 GO 945 456 945 945 84e 84e 735 735 236 236 218 210 184 184 1,186 1,032 B34 780 400 $5.193 $4,681 $4,116 $3,032 $2,911 52,604 $2,100 236 Required: 1. Complete the below table to calculate the trend percents for all components of both statements using 2011 as the base year. (Round your percentage answers to 1 decimal place.) Complete this question by entering your answers in the tabs below. Other paid-in capital Retained earnings Total liabilities and equity 236 236 236 210 210 1.311 1,186 1,832 782 $5,193 $4,681 $4,116 53,032 $2,911 184 184 585 408 $2,604 $2,100 Required: 1. Complete the below table to calculate the trend percents for all components of both statements using 2011 as the base year. (Round your percentage answers to 1 decimal place.) Complete this question by entering your answers in the tabs below. Comp is Comp BS Complete the below table to calculate the trend percents for all components of comparative Income statements using 2011 as the base year. HAROUN COMPANY Income Statement Trends For Years Ended December 31, 2017-2011 2016 2015 2014 2013 % % 2017 2012 2011 95 1000 100.0 Sales Cost of goods sold Gross profit Operating expenses Net Income 100.0 1000 % 100.0 Como s Comp BS > Complete this question by entering your answers in the tabs below. Comp Is Comp BS *** Complete the below table to calculate the trend percents for all components of comparative balance sheets using 2011 as the base year, HAROUN COMPANY Balance Sheet Trends December 31, 2017-2011 2016 2015 2014 2017 2013 2012 2011 % % 100.0% 100.0 100.0 100.0 Assets Cash Accounts receivable.net Merchandise inventory Other current assets Long-term investments Plant assets, net Total assets Liabilities and Equity Current liabilities Long-term liabilities Common stock Other paid in capital Retained earnings Total liabilities & equity 100.0 100.0 100.0 % % 100.0 % 100.0 100.0 100.0 100.0 100,0%