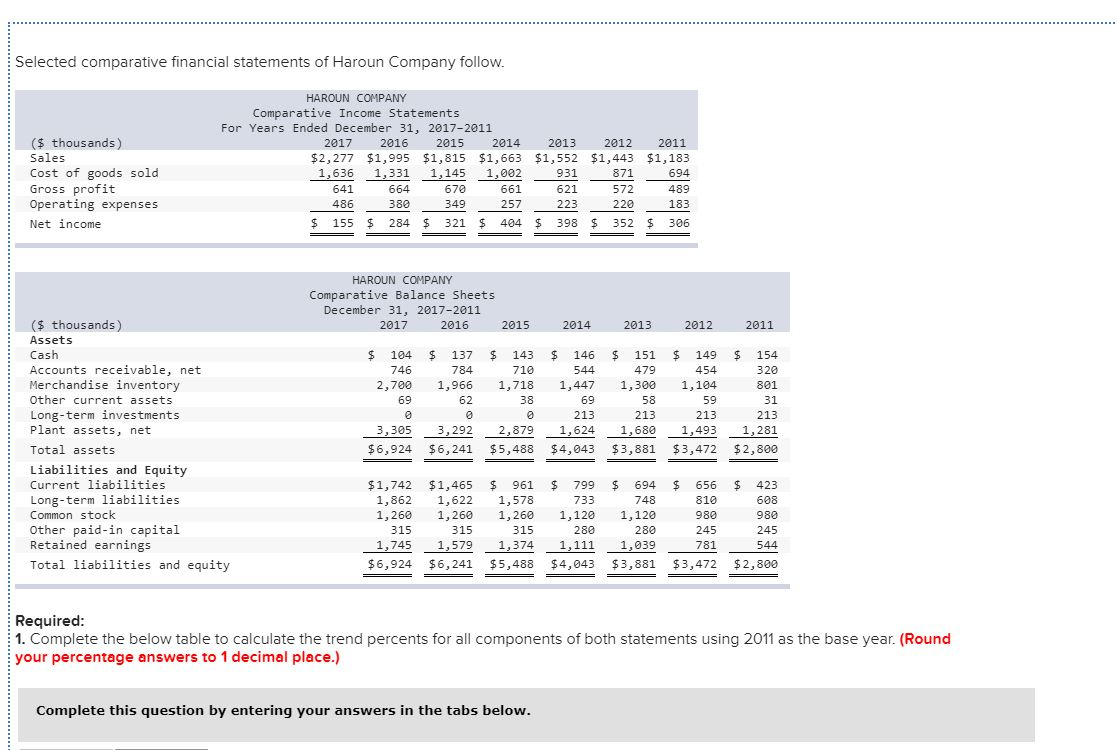
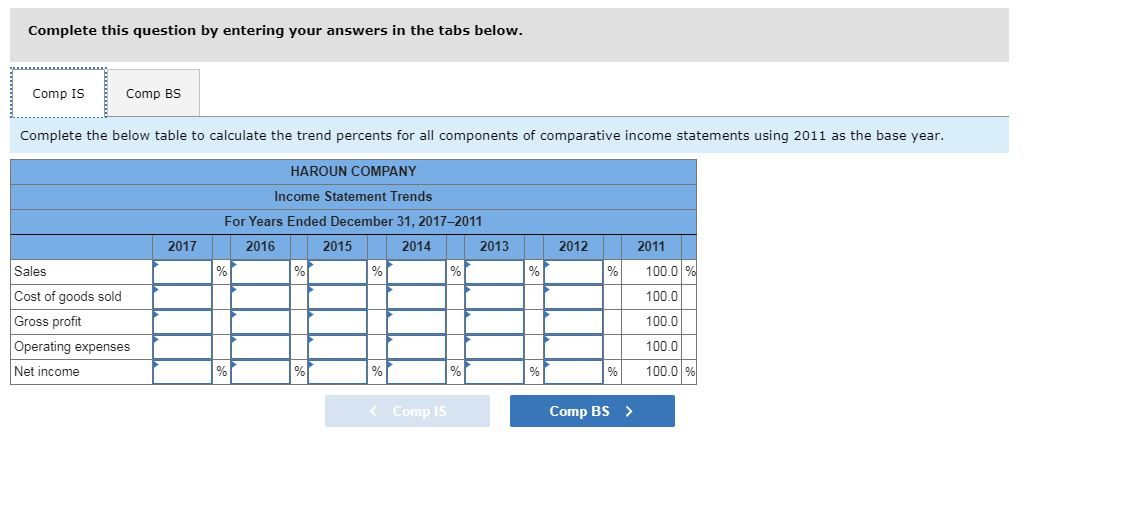
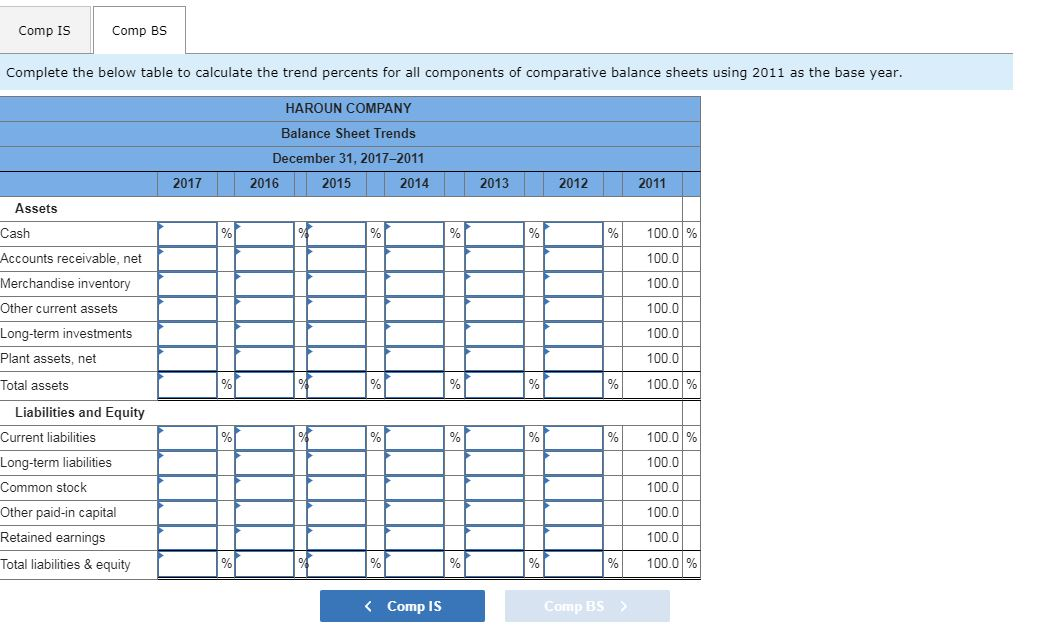
Selected comparative financial statements of Haroun Company follow. ($ thousands) Sales Cost of goods sold Gross profit Operating expenses Net income HAROUN COMPANY Comparative Income Statements For Years Ended December 31, 2017-2011 2017 2016 2015 2014 2013 $2,277 $1,995 $1,815 $1,663 $1,552 1,636 1,331 1,145 1,002 931 641 664 670 661 621 380 349 257 $ 155 $ 284 $ 321 $ 404 $ 398 2012 2011 $1,443 $1,183 871 694 572 489 220 183 $ 352 $ 306 486 223 HAROUN COMPANY Comparative Balance Sheets December 31, 2017-2011 2017 2016 2015 2014 2013 2012 2011 $ 104 746 2,700 $ 137 784 1,966 62 69 ($ thousands) Assets Cash Accounts receivable, net Merchandise inventory Other current assets Long-term investments Plant assets, net Total assets Liabilities and Equity Current liabilities Long-term liabilities Common stock Other paid-in capital Retained earnings Total liabilities and equity $ 143 710 1,718 38 2,879 $5,488 $ 146 544 1,447 69 213 1,624 $4,043 $ 151 479 1,300 58 213 1,680 $3,881 $ 149 454 1,104 59 213 1,493 $3,472 $ 154 320 801 31 213 1,281 $ 2,800 3,305 $6,924 3,292 $6,241 $ 656 810 980 $1,742 1,862 1,260 315 1,745 $6,924 $1,465 $ 961 1,622 1,578 1,260 1,260 315 315 1,5791,374 $6,241 $5,488 $ 799 733 1,120 280 1,111 $4,043 $ 694 748 1,120 280 1,039 $3,881 423 608 980 245 245 781 544 $3,472 $2,800 Required: 1. Complete the below table to calculate the trend percents for all components of both statements using 2011 as the base year. (Round your percentage answers to 1 decimal place.) Complete this question by entering your answers in the tabs below. Complete this question by entering your answers in the tabs below. Comp IS Comp BS Complete the below table to calculate the trend percents for all components of comparative income statements using 2011 as the base year. HAROUN COMPANY Income Statement Trends For Years Ended December 31, 2017-2011 2016 2015 2014 2013 % 2017 2012 () % Sales Cost of goods sold Gross profit Operating expenses 2011 100.0% 100.0 100.0 100.0 100.0 % Net income % Comp 15 Comp BS > Comp IS Comp BS Complete the below table to calculate the trend percents for all components of comparative balance sheets using 2011 as the base year. HAROUN COMPANY Balance Sheet Trends December 31, 2017-2011 2016 2015 2014 2017 2013 2012 2011 100.0 % 100.0 Assets Cash Accounts receivable, net Merchandise inventory Other current assets Long-term investments Plant assets, net 100.0 100.0 100.0 100.0 100.0 % % % % % % % % % % % Total assets Liabilities and Equity Current liabilities Long-term liabilities Common stock Other paid-in capital Retained earnings Total liabilities & equity I D 100.0 % 100.0 100.0 100.0 100.0 100.0% 14 % % %


