

Answered step by step
Verified Expert Solution
Question
1 Approved Answer
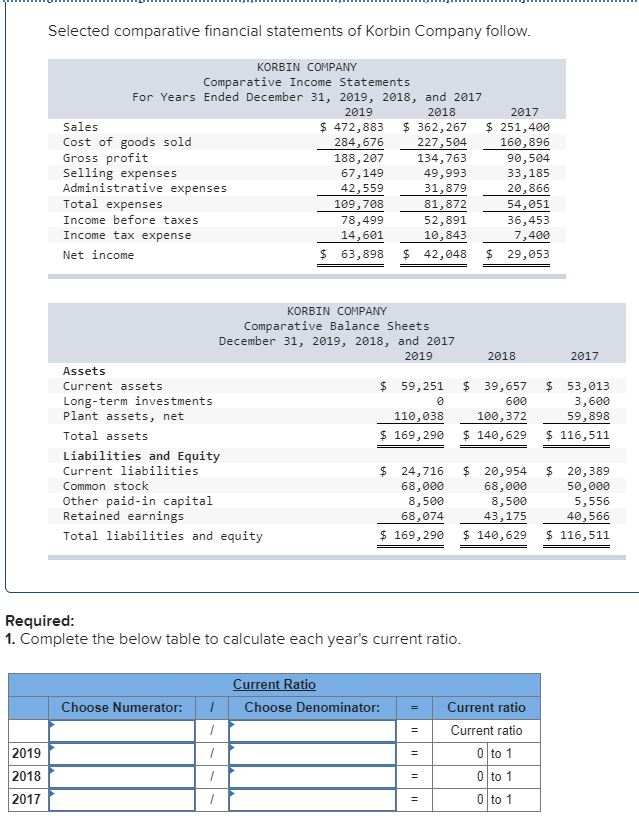
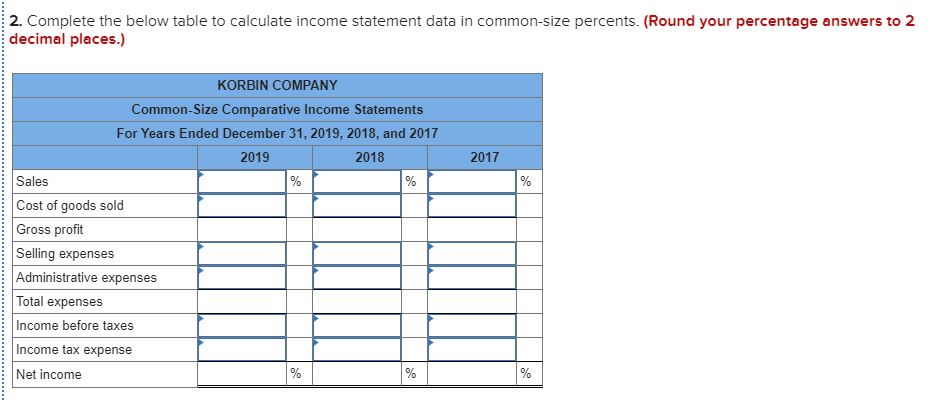
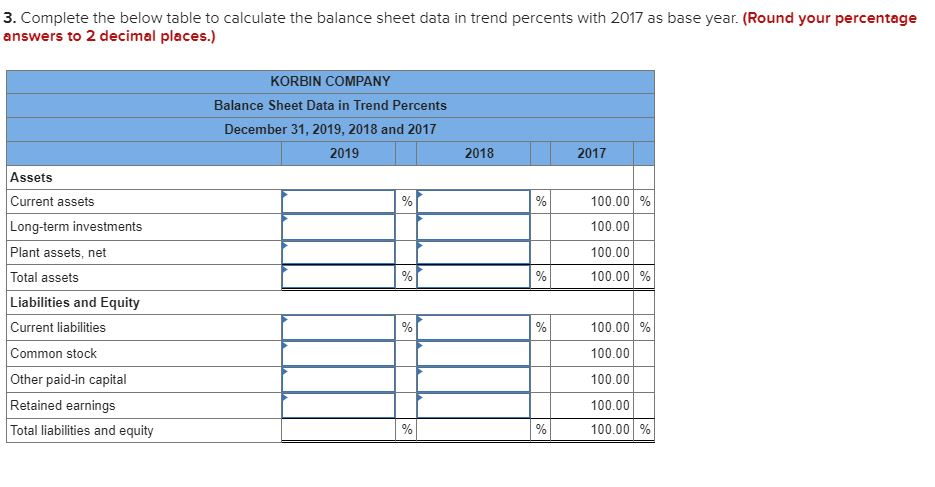
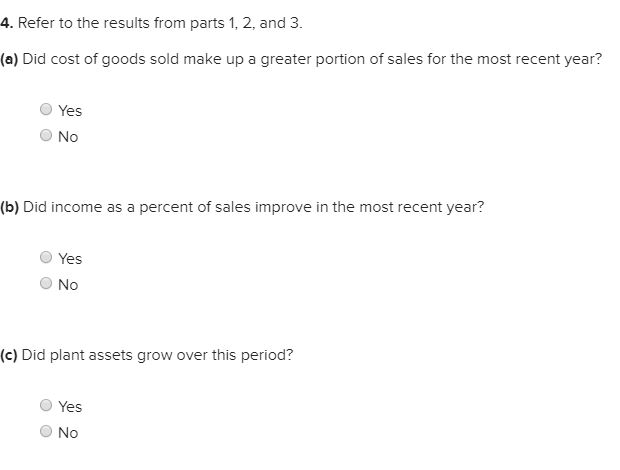
Selected comparative financial statements of Korbin Company follow. 2018 KORBIN COMPANY Comparative Income Statements For Years Ended December 31, 2019, 2018, and 2017 2019 2017
Step by Step Solution
There are 3 Steps involved in it
Step: 1

Get Instant Access to Expert-Tailored Solutions
See step-by-step solutions with expert insights and AI powered tools for academic success
Step: 2

Step: 3
Ace Your Homework with AI
Get the answers you need in no time with our AI-driven, step-by-step assistance
Get Started
Primary Science Audit And Test
Authors: Jenny Byrne, Andri Christodoulou, John Sharp
4th Edition
1446282732, 978-1446282731