

Answered step by step
Verified Expert Solution
Question
1 Approved Answer
Selected comparative financial statements of Korbin Company follow: KORBIN COMPANY Comparative Income Statements For Years Ended December 31, 2014, 2013, and 2012 2014 2013 2012
| Selected comparative financial statements of Korbin Company follow: |
| KORBIN COMPANY | ||||||||||||
| Comparative Income Statements | ||||||||||||
| For Years Ended December 31, 2014, 2013, and 2012 | ||||||||||||
| 2014 | 2013 | 2012 | ||||||||||
| Sales | $ | 561,290 | $ | 429,994 | $ | 298,400 | ||||||
| Cost of goods sold | 337,897 | 270,896 | 190,976 | |||||||||
| Gross profit | 223,393 | 159,098 | 107,424 | |||||||||
| Selling expenses | 79,703 | 59,339 | 39,389 | |||||||||
| Administrative expenses | 50,516 | 37,839 | 24,767 | |||||||||
| Total expenses | 130,219 | 97,178 | 64,156 | |||||||||
| Income before taxes | 93,174 | 61,920 | 43,268 | |||||||||
| Income taxes | 17,330 | 12,694 | 8,783 | |||||||||
| Net income | $ | 75,844 | $ | 49,226 | $ | 34,485 | ||||||
| KORBIN COMPANY | ||||||||||||
| Comparative Balance Sheets | ||||||||||||
| December 31, 2014, 2013, and 2012 | ||||||||||||
| 2014 | 2013 | 2012 | ||||||||||
| Assets | ||||||||||||
| Current assets | $ | 54,191 | $ | 42,398 | $ | 56,676 | ||||||
| Long-term investments | 0 | 900 | 3,070 | |||||||||
| Plant assets, net | 99,107 | 105,560 | 63,583 | |||||||||
| Total assets | $ | 153,298 | $ | 148,858 | $ | 123,329 | ||||||
| Liabilities and Equity | ||||||||||||
| Current liabilities | $ | 22,382 | $ | 22,180 | $ | 21,583 | ||||||
| Common stock | 63,000 | 63,000 | 45,000 | |||||||||
| Other paid-in capital | 7,875 | 7,875 | 5,000 | |||||||||
| Retained earnings | 60,041 | 55,803 | 51,746 | |||||||||
| Total liabilities and equity | $ | 153,298 | $ | 148,858 | $ | 123,329 | ||||||
| . | Complete the below table to calculate income statement data in common-size percents. (Round your answers to 2 decimal places.) |
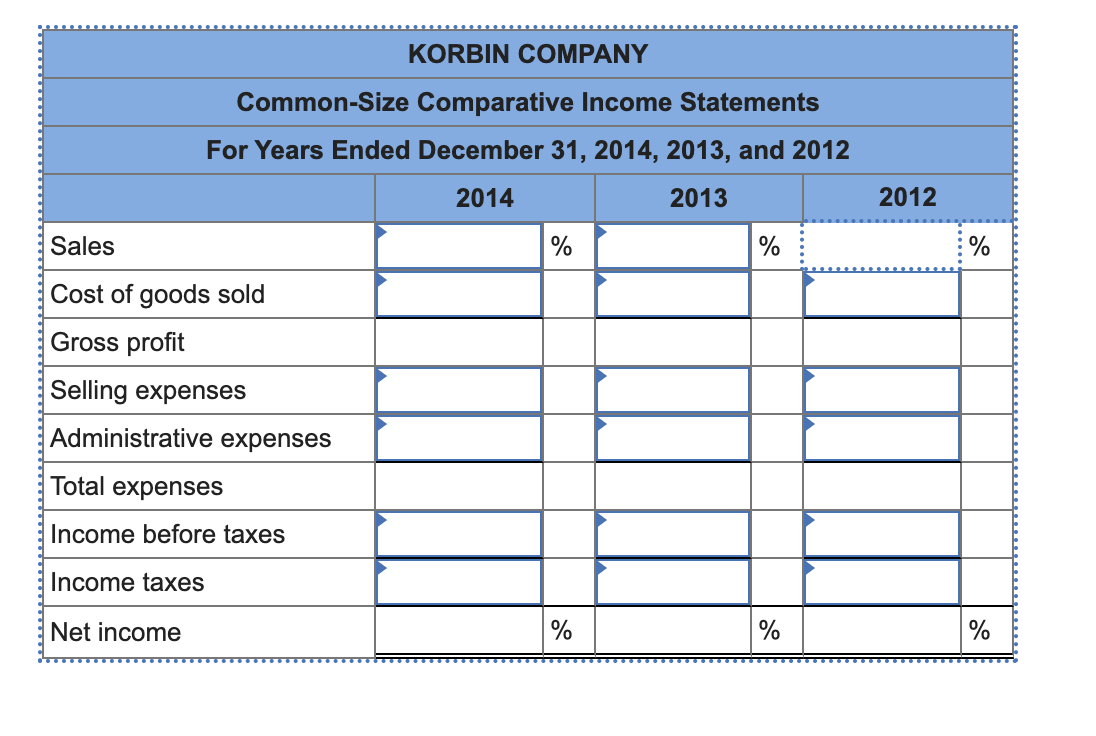 KORBIN COMPANY Common-Size Comparative Income Statements
 Step by Step Solution
There are 3 Steps involved in it
Step: 1

Get Instant Access to Expert-Tailored Solutions
See step-by-step solutions with expert insights and AI powered tools for academic success
Step: 2

Step: 3
Ace Your Homework with AI
Get the answers you need in no time with our AI-driven, step-by-step assistance
Get Started
Budget Responsibility And National Audit Bill Source Book Edition Current Political Debates Of The UK Parliament 55th Parliament Volume
Authors: Jeff Nelson
1st Edition
3845468017, 978-3845468013