

Answered step by step
Verified Expert Solution
Question
1 Approved Answer
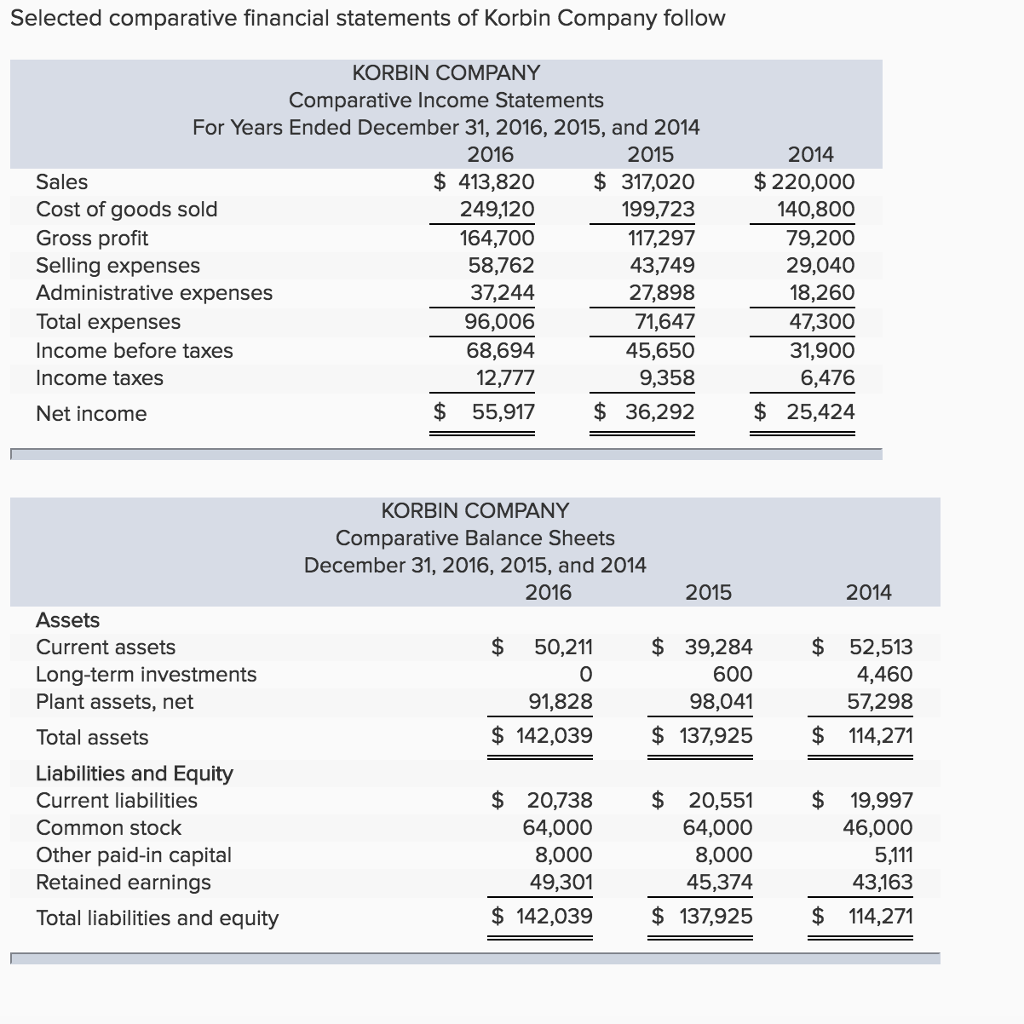
Selected comparative financial statements of Korbin Company follow KORBIN COMPANY Comparative Income Statements For Years Ended December 31, 2016, 2015, and 2014 2016 2015 2014
Step by Step Solution
There are 3 Steps involved in it
Step: 1

Get Instant Access to Expert-Tailored Solutions
See step-by-step solutions with expert insights and AI powered tools for academic success
Step: 2

Step: 3
Ace Your Homework with AI
Get the answers you need in no time with our AI-driven, step-by-step assistance
Get Started
Accounts And Audit Of Limited Liability Partnerships
Authors: Steve Collings
4th Edition
1847669913, 978-1847669919