

Answered step by step
Verified Expert Solution
Question
1 Approved Answer
Selected comparative financial statements of Korbin Company follow. KORBIN COMPANY Comparative Income Statements For Years Ended December 31, 2020, 2019, and 2018 2020 2019 2018
Selected comparative financial statements of Korbin Company follow.
| KORBIN COMPANY | |||||||||||||||||||||
| Comparative Income Statements | |||||||||||||||||||||
| For Years Ended December 31, 2020, 2019, and 2018 | |||||||||||||||||||||
| 2020 | 2019 | 2018 | |||||||||||||||||||
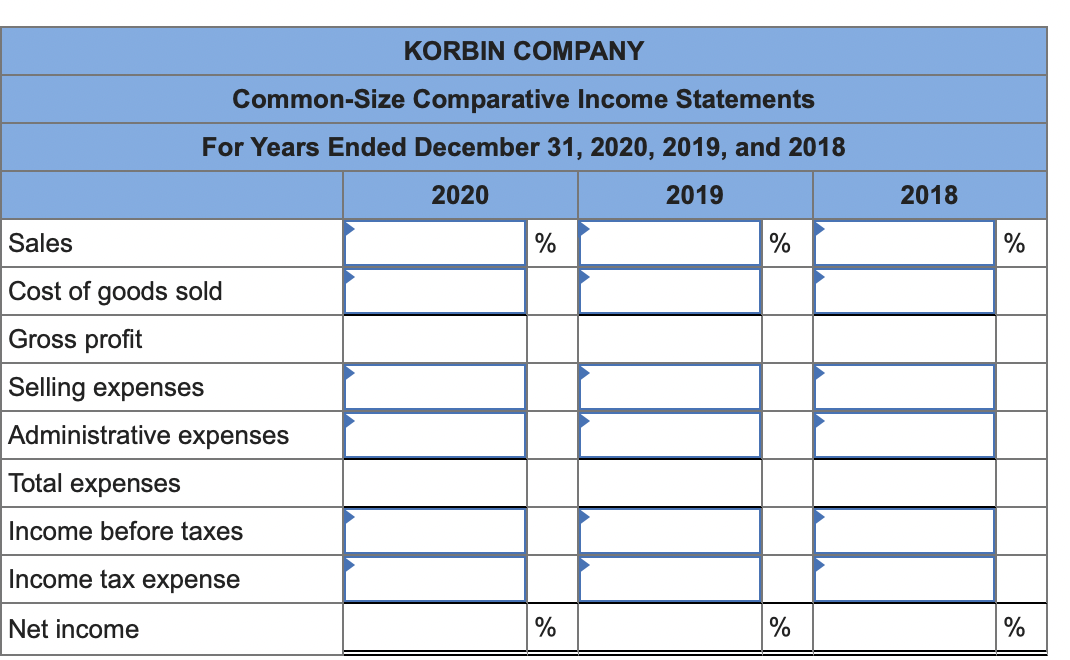
| Sales | $ | 555,000 | $ | 340,000 | $ | 278,000 | |||||||||||||||
| Cost of goods sold | 283,500 | 212,500 | 153,900 | ||||||||||||||||||
| Gross profit | 271,500 | 127,500 | 124,100 | ||||||||||||||||||
| Selling expenses | 102,900 | 46,920 | 50,800 | ||||||||||||||||||
| Administrative expenses | 50,668 | 29,920 | 22,800 | ||||||||||||||||||
| Total expenses | 153,568 | 76,840 | 73,600 | ||||||||||||||||||
| Income before taxes | 117,932 | 50,660 | 50,500 | ||||||||||||||||||
| Income tax expense | 40,800 | 10,370 | 15,670 | ||||||||||||||||||
| Net income | $ | 77,132 | $ | 40,290 | $ | 34,830 | |||||||||||||||
| KORBIN COMPANY | |||||||||||||||||||||
| Comparative Balance Sheets | |||||||||||||||||||||
| December 31, 2020, 2019, and 2018 | |||||||||||||||||||||
| 2020 | 2019 | 2018 | |||||||||||||||||||
| Assets | |||||||||||||||||||||
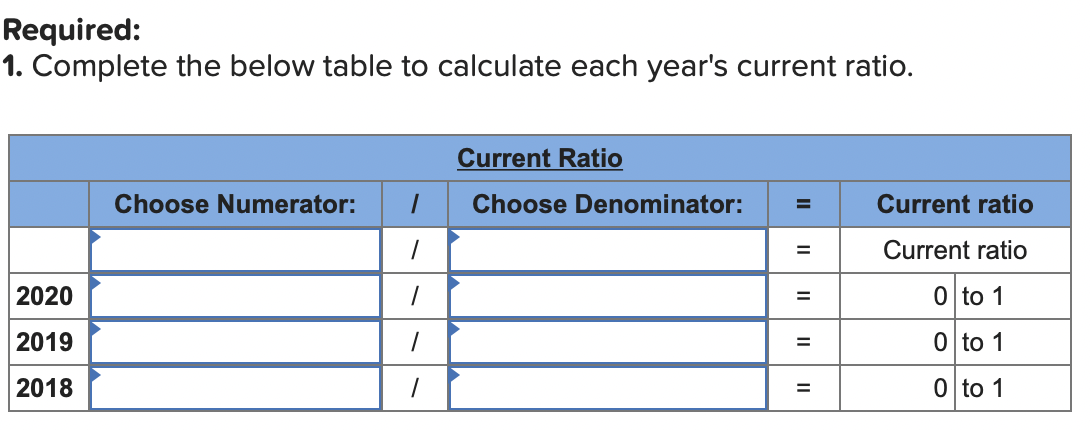
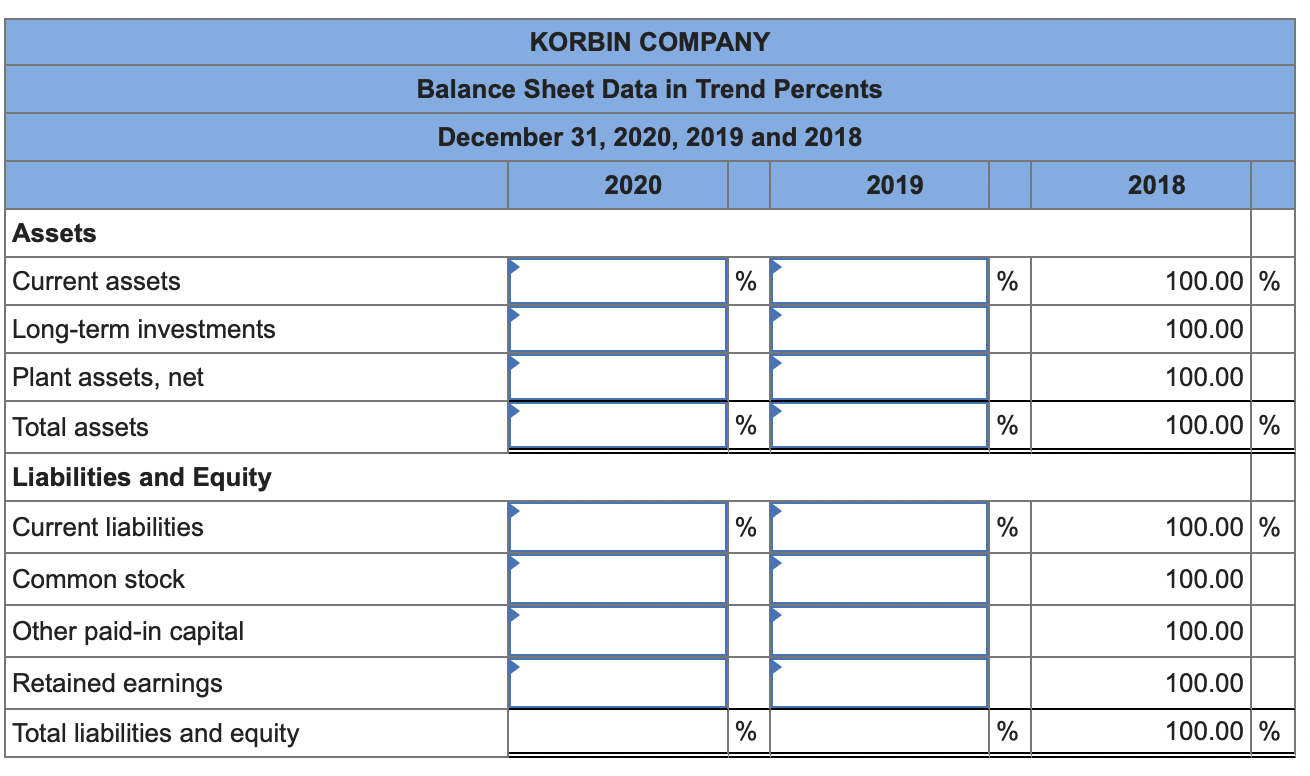
| Current assets | $ | 52,390 | $ | 37,924 | $ | 51,748 | |||||||||||||||
| Long-term investments | 0 | 500 | 3,950 | ||||||||||||||||||
| Plant assets, net | 100,000 | 96,000 | 60,000 | ||||||||||||||||||
| Total assets | $ | 152,390 | $ | 134,424 | $ | 115,698 | |||||||||||||||
| Liabilities and Equity | |||||||||||||||||||||
| Current liabilities | $ | 22,800 | $ | 19,960 | $ | 20,300 | |||||||||||||||
| Common stock | 72,000 | 72,000 | 60,000 | ||||||||||||||||||
| Other paid-in capital | 9,000 | 9,000 | 6,000 | ||||||||||||||||||
| Retained earnings | 48,590 | 33,464 | 29,398 | ||||||||||||||||||
| Total liabilities and equity | $ | 152,390 | $ | 134,424 | $ | 115,698 | |||||||||||||||
Step by Step Solution
There are 3 Steps involved in it
Step: 1

Get Instant Access to Expert-Tailored Solutions
See step-by-step solutions with expert insights and AI powered tools for academic success
Step: 2

Step: 3
Ace Your Homework with AI
Get the answers you need in no time with our AI-driven, step-by-step assistance
Get Started
Cash And Financial Management Study Text
Authors: Kaplan
1st Edition
9781839960529