Answered step by step
Verified Expert Solution
Question
1 Approved Answer
Selected comparative financial statements of Korbin Company follow. KORBIN COMPANY Comparative Income Statements For Years Ended December 31, 2021, 2020, and 2019 2021 2020 2019
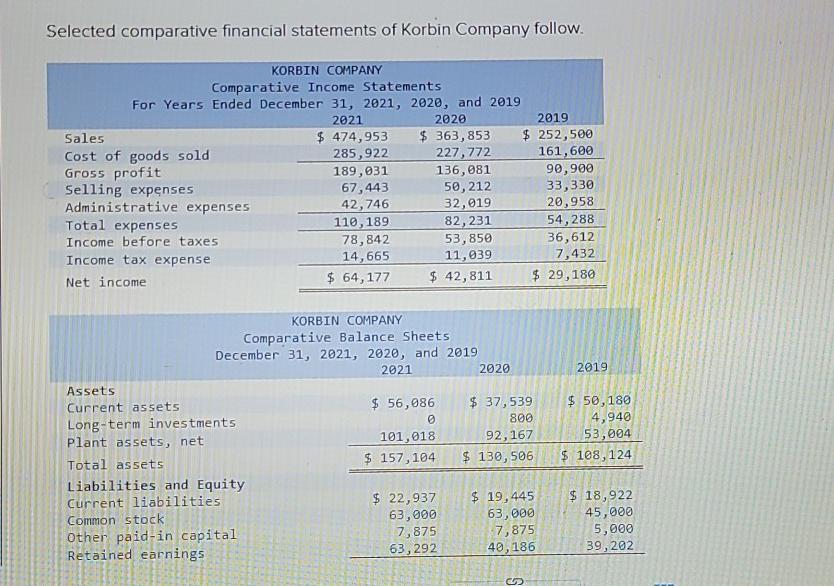
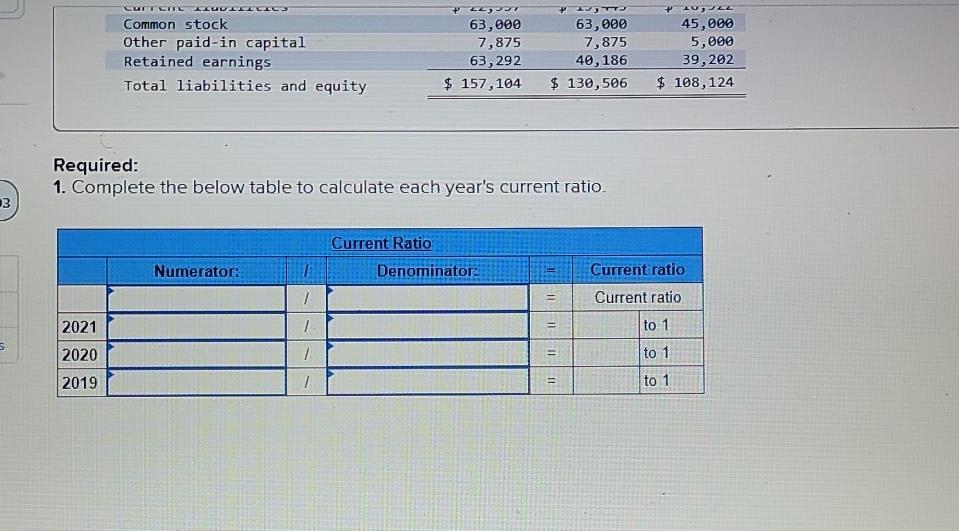
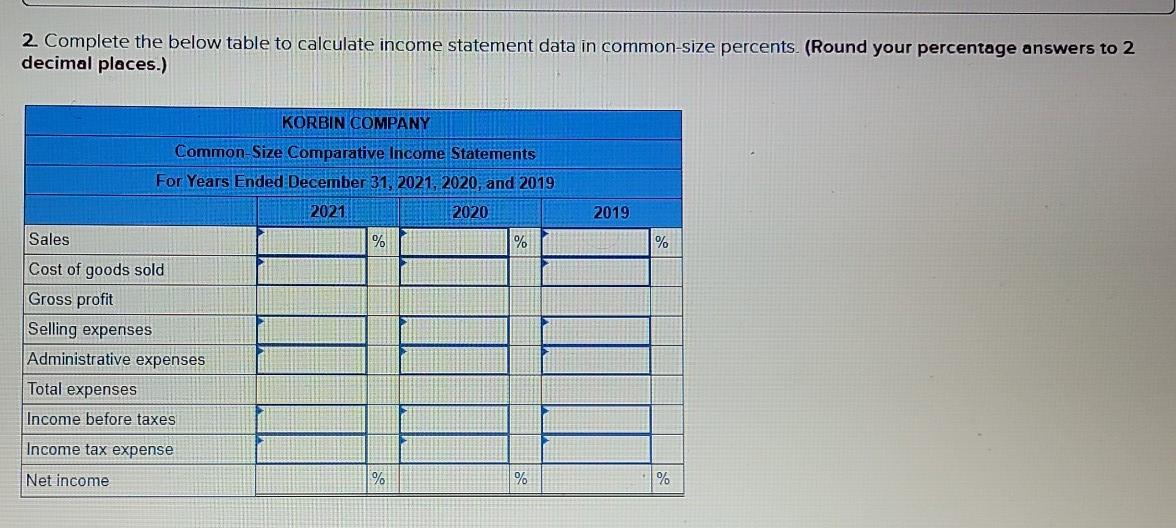
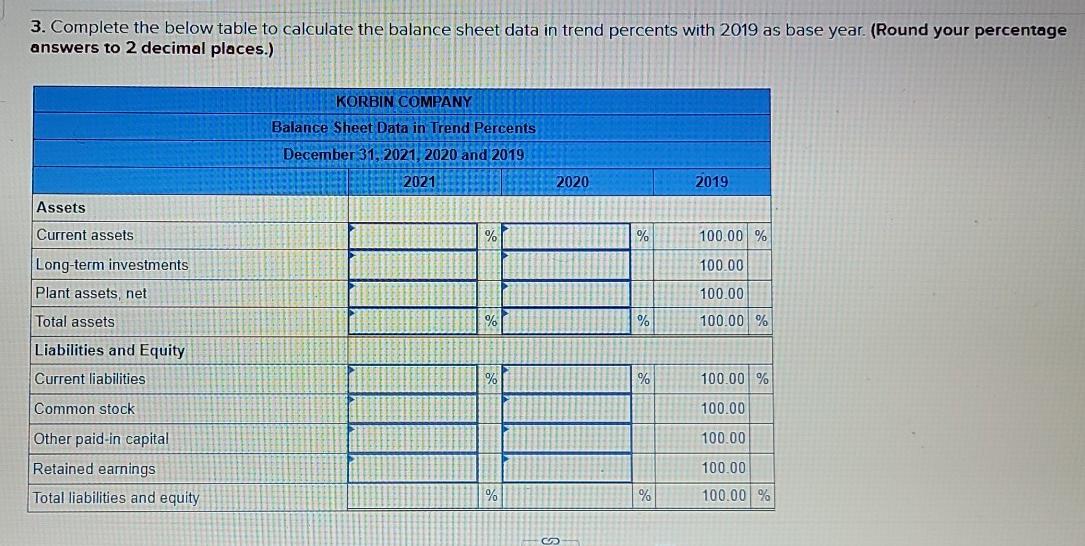
Selected comparative financial statements of Korbin Company follow. KORBIN COMPANY Comparative Income Statements For Years Ended December 31, 2021, 2020, and 2019 2021 2020 2019 Sales $ 474,953 $ 363,853 $ 252,500 Cost of goods sold 285,922 227,772 161,600 Gross profit 189,031 136,081 90,900 Selling expenses 67,443 50,212 33,330 Administrative expenses 42,746 32,019 20,958 Total expenses 110, 189 82,231 54,288 Income before taxes 78,842 53,850 36,612 Income tax expense 14,665 11,939 7,432 Net income $ 64,177 $ 42,811 $ 29,180 2019 KORBIN COMPANY Comparative Balance Sheets December 31, 2021, 2020, and 2019 20211 2020 Assets Current assets $ 56,086 $ 37,539 Long-term investments 800 Plant assets, net 101,018 92,167 Total assets $ 157,104 $ 130,506 Liabilities and Equity Current liabilities $ 22,937 $ 19,445 Common stock 63,000 63,000 Other paid-in capital 7,875 7,875 Retained earnings 63,292 40, 186 $ 50, 180 4,940 53,004 $ 108, 124 $ 18,922 45,000 5,000 39,202 CURCITE ILUUIIELIC Common stock Other paid-in capital Retained earnings Total liabilities and equity 2237 63,000 7,875 63,292 $ 157,104 63,000 7,875 40,186 $ 130,506 45,000 5,000 39,202 $ 108,124 Required: 1. Complete the below table to calculate each year's current ratio. 3 Current Ratio Numerator: Denominator Current ratio Current ratio 11 / 11 to 1 2021 2020 5 11 1 to 1 2019 11 1 to 1 2. Complete the below table to calculate income statement data in common-size percents. (Round your percentage answers to 2 decimal places.) KORBIN COMPANY Common-Size Comparative Income Statements For Years Ended December 31, 2021, 2020, and 2019 2021 2020 2019 Sales % % % Cost of goods sold Gross profit Selling expenses Administrative expenses Total expenses Income before taxes Income tax expense Net income % % % 3. Complete the below table to calculate the balance sheet data in trend percents with 2019 as base year. (Round your percentage answers to 2 decimal places.) KORBIN COMPANY Balance Sheet Data in Trend Percents December 31, 2021, 2020 and 2019 2021 2020 2019 Assets Current assets % H% 100.00 % Long-term investments 100.00 Plant assets, net 100.00 t | % % 100.00 % Total assets Liabilities and Equity Current liabilities % % 100.00 % Common stock 100.00 100.00 Other paid-in capital Retained earnings Total liabilities and equity 100.00 % % 100.00 %
Step by Step Solution
There are 3 Steps involved in it
Step: 1

Get Instant Access to Expert-Tailored Solutions
See step-by-step solutions with expert insights and AI powered tools for academic success
Step: 2

Step: 3

Ace Your Homework with AI
Get the answers you need in no time with our AI-driven, step-by-step assistance
Get Started


