

Answered step by step
Verified Expert Solution
Question
1 Approved Answer
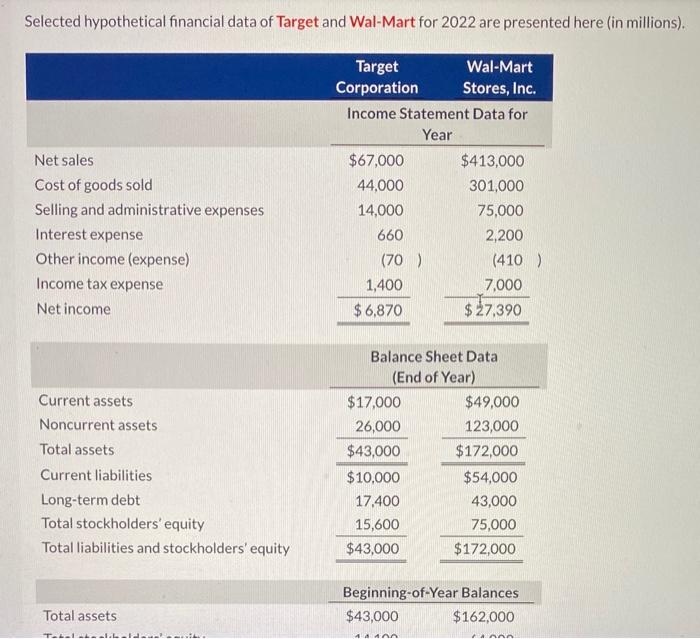
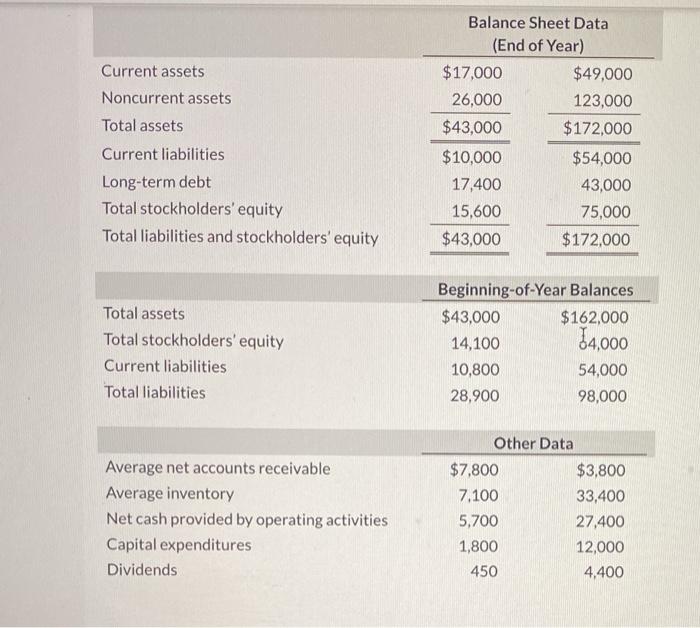
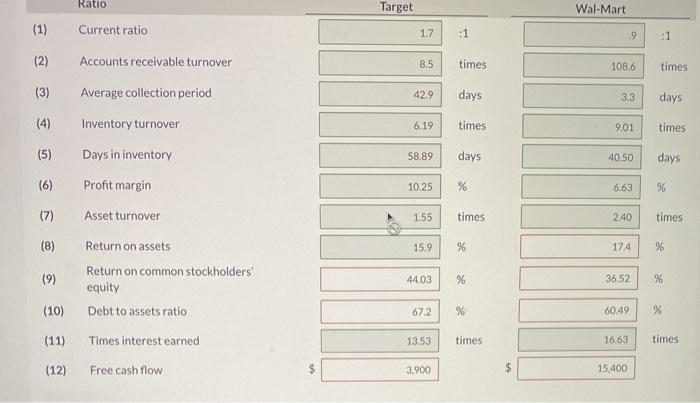
Selected hypothetical financial data of Target and Wal-Mart for 2022 are presented here (in millions). Net sales Cost of goods sold Selling and administrative expenses
Step by Step Solution
There are 3 Steps involved in it
Step: 1

Get Instant Access to Expert-Tailored Solutions
See step-by-step solutions with expert insights and AI powered tools for academic success
Step: 2

Step: 3
Ace Your Homework with AI
Get the answers you need in no time with our AI-driven, step-by-step assistance
Get Started
Financial Accounting Standards Board Webster S Timeline History 1971 2006
Authors: Icon Group International
1st Edition
0546876501, 978-0546876505