

Answered step by step
Verified Expert Solution
Question
1 Approved Answer
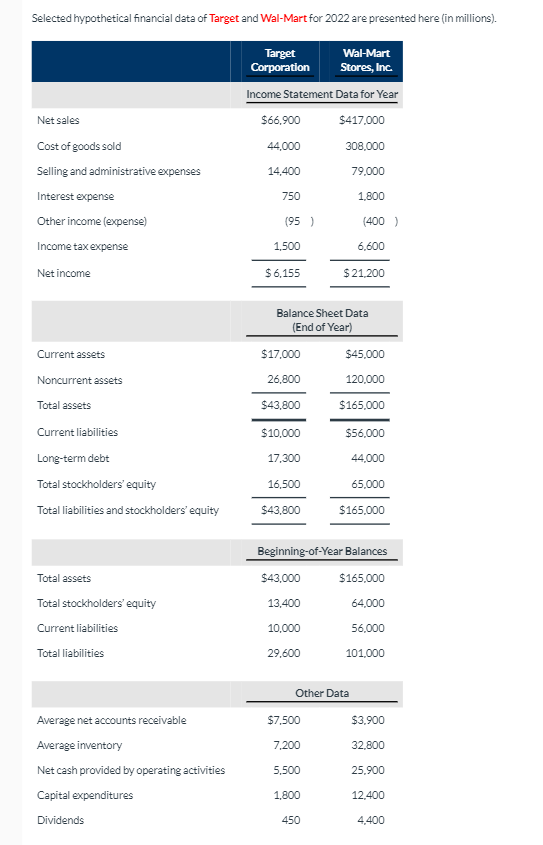
Selected hypothetical financial data of Target and Wal-Mart for 2022 are presented here (in millions). Target Wal-Mart Corporation Stores, Inc Income Statement Data for Year
Step by Step Solution
There are 3 Steps involved in it
Step: 1

Get Instant Access to Expert-Tailored Solutions
See step-by-step solutions with expert insights and AI powered tools for academic success
Step: 2

Step: 3
Ace Your Homework with AI
Get the answers you need in no time with our AI-driven, step-by-step assistance
Get Started
Auditing a risk based approach to conducting a quality audit
Authors: Karla Johnstone, Audrey Gramling, Larry Rittenberg
9th edition
9781133939160, 1133939155, 1133939163, 978-1133939153