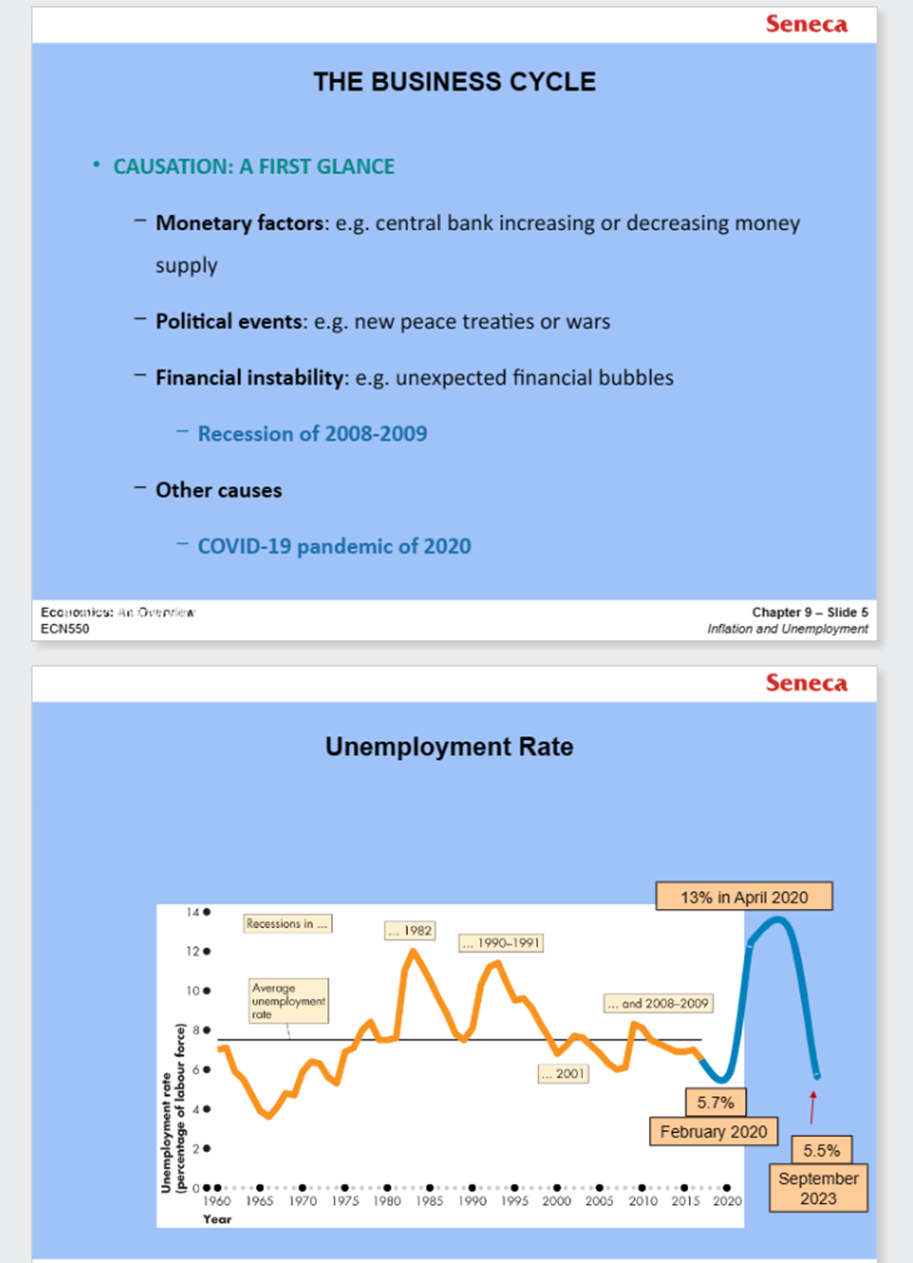
Seneca THE BUSINESS CYCLE . CAUSATION: A FIRST GLANCE - Monetary factors: e.g. central bank increasing or decreasing money supply - Political events: e.g. new
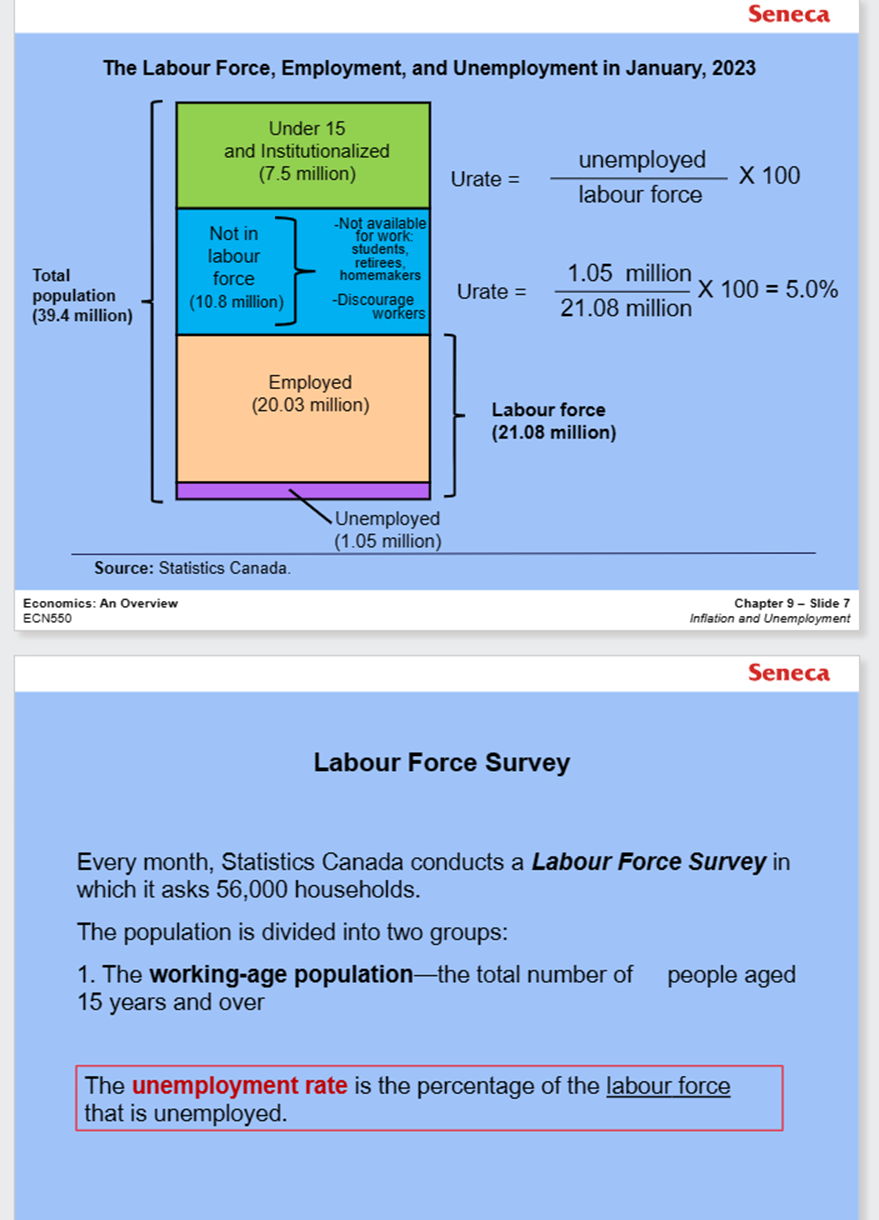
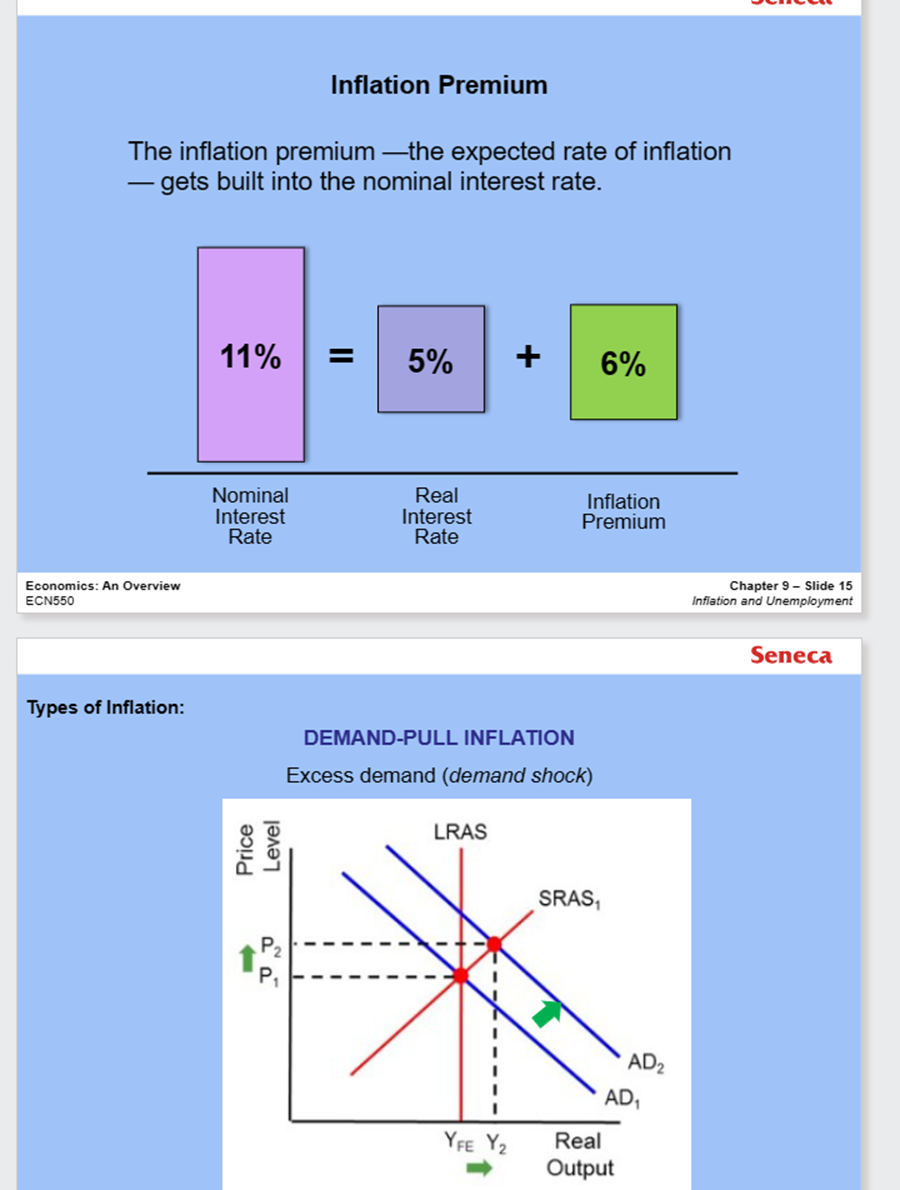
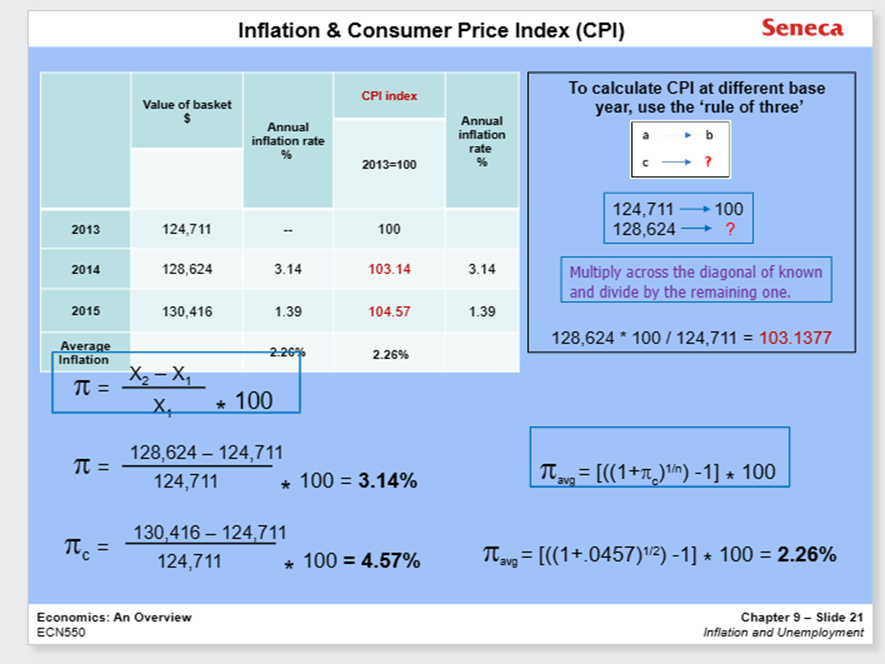
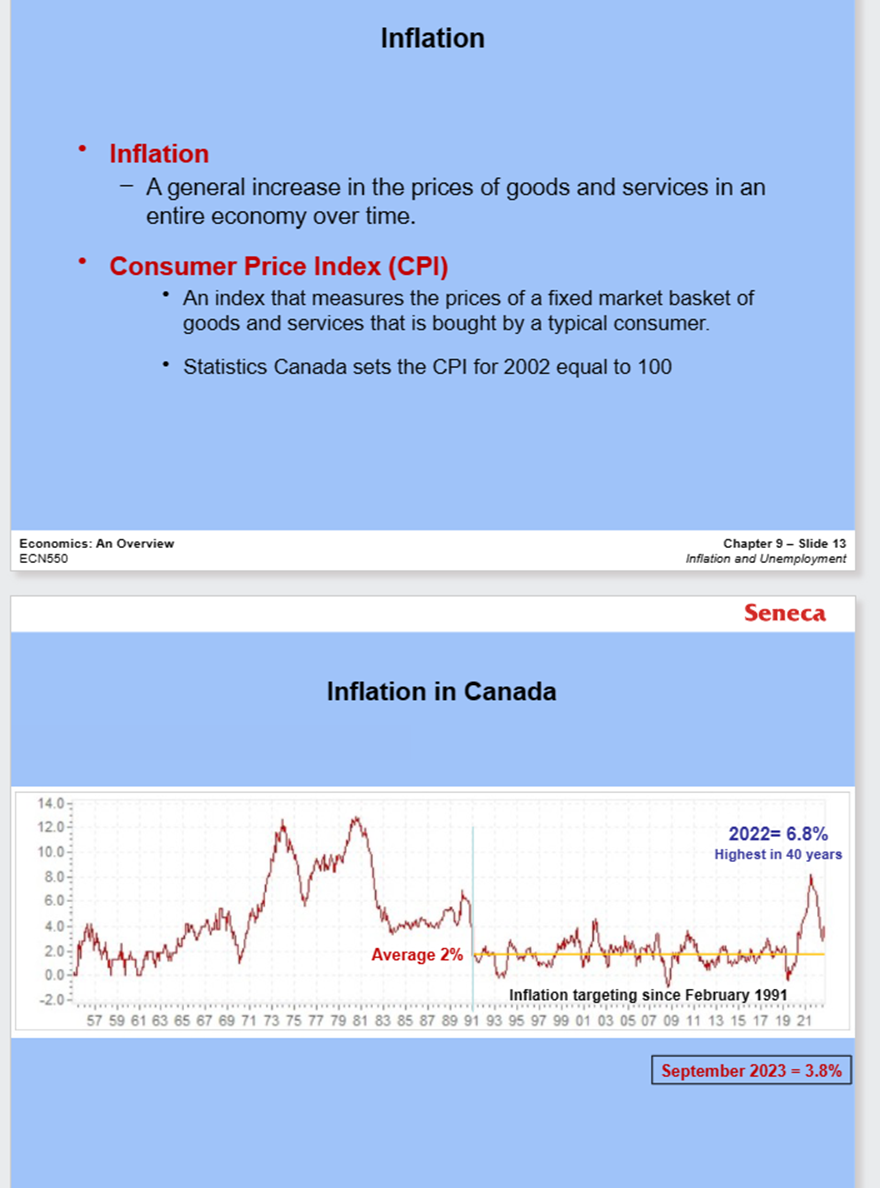
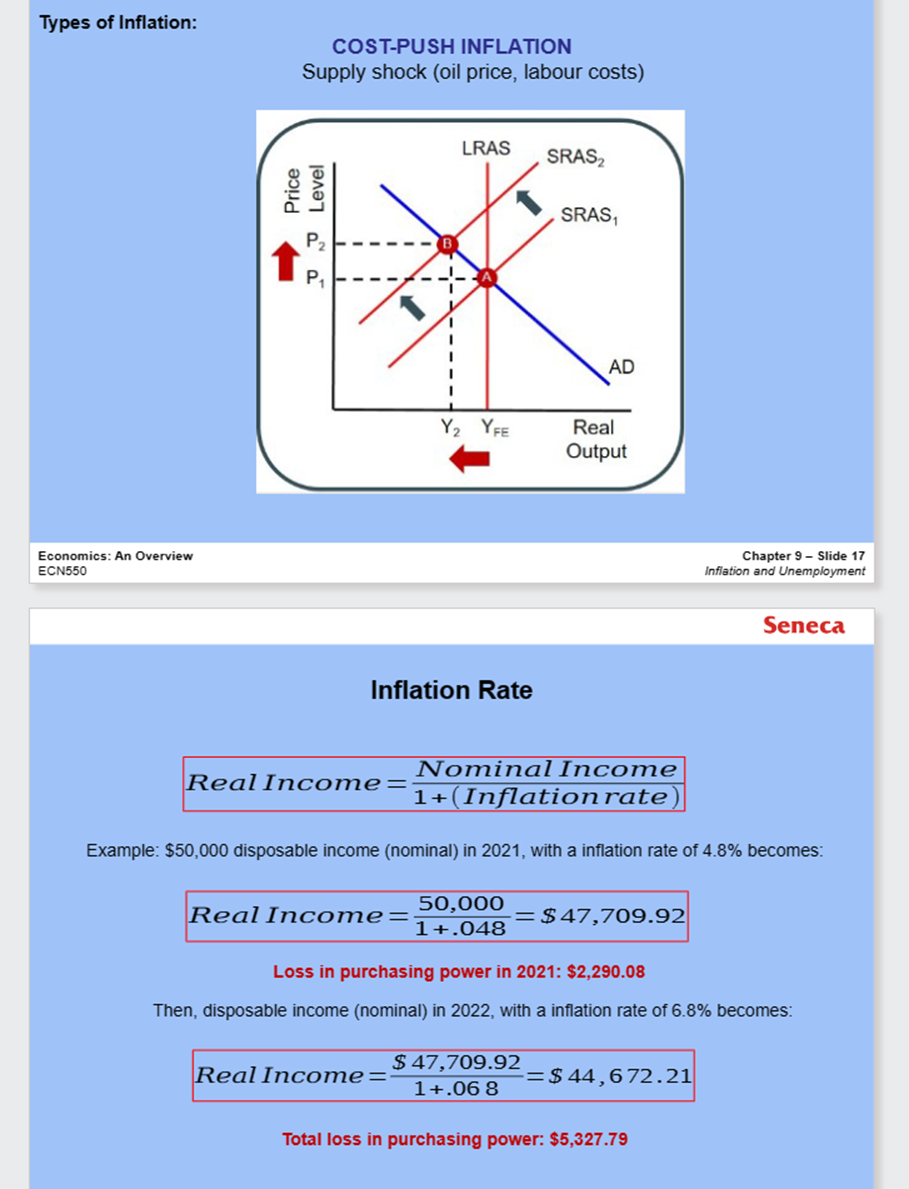
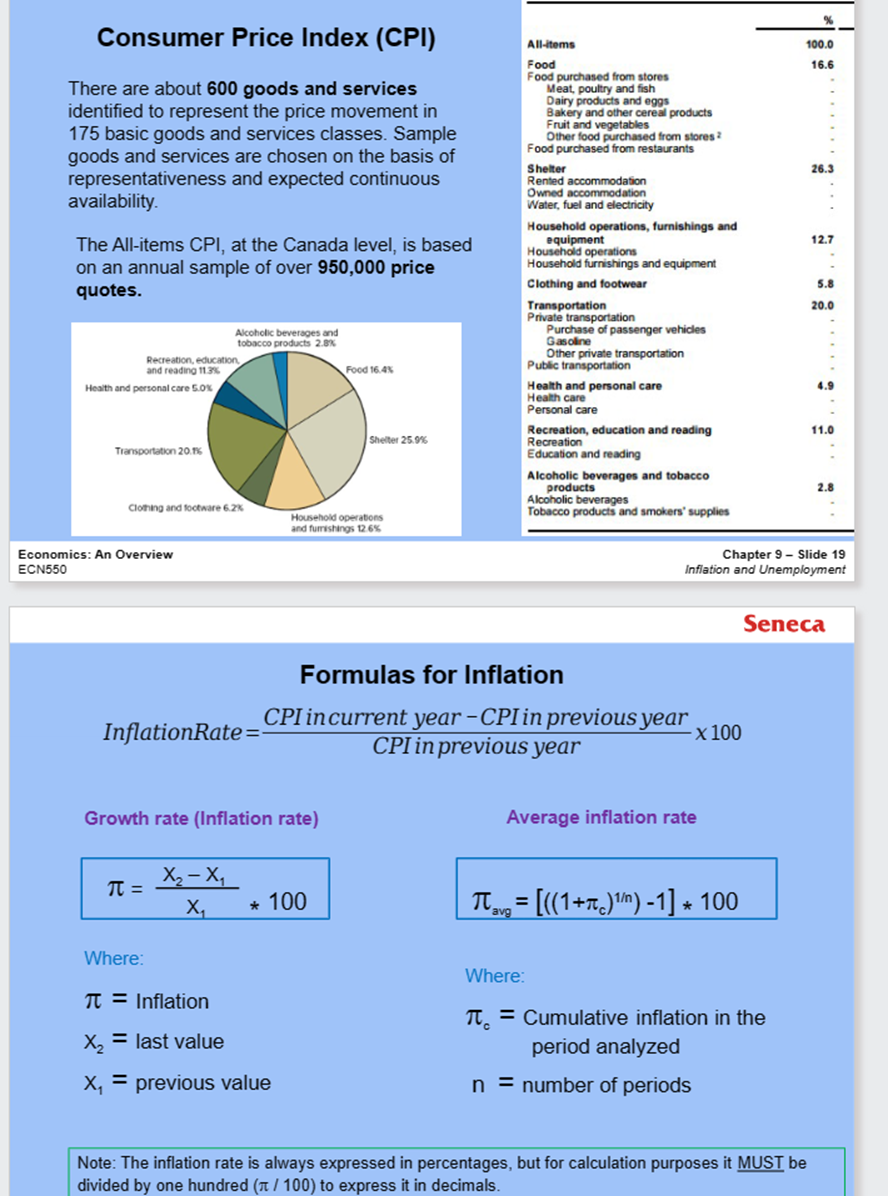
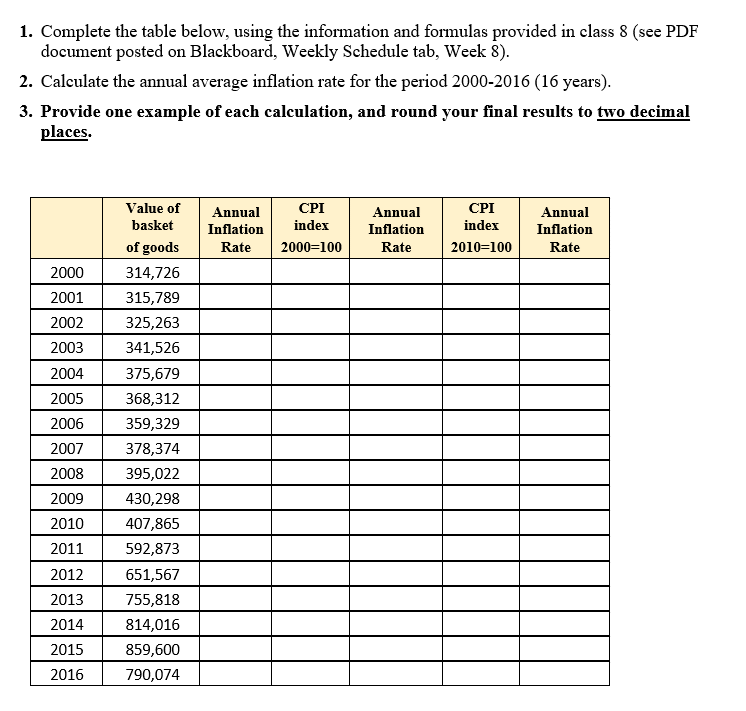
Seneca THE BUSINESS CYCLE . CAUSATION: A FIRST GLANCE - Monetary factors: e.g. central bank increasing or decreasing money supply - Political events: e.g. new peace treaties or wars - Financial instability: e.g. unexpected financial bubbles - Recession of 2008-2009 - Other causes COVID-19 pandemic of 2020 Economics: An Overtien Chapter 9 - Slide 5 ECN550 Inflation and Unemployment Seneca Unemployment Rate 13% in April 2020 140 Recessions in ... ... 1982 ... 1990-1991 120 10 0 Average unemployment ... and 2008-2009 rate 80 6 ... 2001 5.7% (percentage of labour force) Unemployment rate February 2020 N 5.5% September 0... 1960 1965 1970 1975 1980 1985 1990 1995 2000 2005 2010 2015 2020 2023 YearSeneca The Labour Force, Employment, and Unemployment in January, 2023 Under 15 and Institutionalized unemployed (7.5 million) Urate = X 100 labour force Not available Not in for work: labour students, retirees, Total force homemakers 1.05 million population (10.8 million) -Discourage Urate = X 100 = 5.0% (39.4 million) workers 21.08 million Employed (20.03 million) Labour force (21.08 million) Unemployed (1.05 million) Source: Statistics Canada. Economics: An Overview Chapter 9 - Slide 7 ECN550 Inflation and Unemployment Seneca Labour Force Survey Every month, Statistics Canada conducts a Labour Force Survey in which it asks 56,000 households. The population is divided into two groups: 1. The working-age population-the total number of people aged 15 years and over The unemployment rate is the percentage of the labour force that is unemployed.Inflation Inflation A general increase in the prices of goods and services in an entire economy over time. . Consumer Price Index (CPI) An index that measures the prices of a fixed market basket of goods and services that is bought by a typical consumer. . Statistics Canada sets the CPI for 2002 equal to 100 Economics: An Overview Chapter 9 - Slide 13 ECN550 Inflation and Unemployment Seneca Inflation in Canada 14.0- 12.0 2022= 6.8% 10.0- Highest in 40 years 8.05 6.0 2.0- Average 2% 0.0 -2.0- Inflation targeting since February 1991 57 59 61 63 65 67 69 71 73 75 77 79 81 83 85 87 89 91 93 95 97 99 01 03 05 07 09 11 13 15 17 19 21 September 2023 = 3.8%Inflation Premium The inflation premium -the expected rate of inflation - gets built into the nominal interest rate. 11% 5% + 6% Nominal Real Inflation Interest Interest Premium Rate Rate Economics: An Overview Chapter 9 - Slide 15 ECN550 Inflation and Unemployment Seneca Types of Inflation: DEMAND-PULL INFLATION Excess demand (demand shock) LRAS Level Price SRAS, P2 AD2 AD, YFE Y2 Real OutputTypes of Inflation: COST-PUSH INFLATION Supply shock (oil price, labour costs) LRAS SRAS2 Price SRAS, 0 3 Level AD Y2 YFE Real Output Economics: An Overview Chapter 9 - Slide 17 ECN550 Inflation and Unemployment Seneca Inflation Rate _ Nominal Income Real Income =1+ (Inflationrate) Example: $50,000 disposable income (nominal) in 2021, with a inflation rate of 4.8% becomes: Real Income = 30,000 1+.048 = $47,709.92 Loss in purchasing power in 2021: $2,290.08 Then, disposable income (nominal) in 2022, with a inflation rate of 6.8% becomes: Real Income = $ 47,709.92 1+.068 = $44, 672.21 Total loss in purchasing power: $5,327.79Consumer Price Index (CPI) All-items 100.0 Food 16.6 Food purchased from stores There are about 600 goods and services Meat, poultry and fish Dairy products and eggs identified to represent the price movement in Bakery and other cereal products 175 basic goods and services classes. Sample Fruit and vegetables Other food purchased from stores ? goods and services are chosen on the basis of Food purchased from restaurants Shelter 26.3 representativeness and expected continuous Rented accommodation Owned accommodation availability. Water, fuel and electricity Household operations, furnishings and The All-items CPI, at the Canada level, is based equipment 12.7 Household operations on an annual sample of over 950,000 price Household furnishings and equipment 5.8 quotes. Clothing and footwear Transportation 20.0 Private transportation Alcoholic beverages and Purchase of passenger vehicles tobacco products 2.8% Gasoline Recreation, education Other private transportation and reading 11.3% Food 16.4% Public transportation Health and personal care 5.0% Health and personal care 4.9 Health care Personal care Recreation, education and reading 11.0 Shelter 25.9% Recreation Transportation 20.1 Education and reading Alcoholic beverages and tobacco products 2.8 Alcoholic beverages Clothing and footware 6.2% Household operations Tobacco products and smokers' supplies and fumishings 12 6%% Economics: An Overview Chapter 9 - Slide 19 ECN550 Inflation and Unemployment Seneca Formulas for Inflation InflationRate =- CPI incurrent year -CPI in previous year - x 100 CPI in previous year Growth rate (Inflation rate) Average inflation rate D= X2- X1 * 100 Ihave = [((1+Tic)1/in) -1] = 100 Where: Where: It = Inflation It = Cumulative inflation in the X, = last value period analyzed X, = previous value n = number of periods Note: The inflation rate is always expressed in percentages, but for calculation purposes it MUST be divided by one hundred (it / 100) to express it in decimals.Inflation & Consumer Price Index (CPI) Seneca CPI index To calculate CPI at different base Value of basket year, use the 'rule of three' Annual Annual inflation rate inflation % rate 2013=100 9% 124,711 100 2013 124,711 100 128,624 ? 2014 128,624 3.14 103.14 3.14 Multiply across the diagonal of known and divide by the remaining one. 2015 130,416 1.39 104.57 1.39 Average 128,624 * 100 / 124,711 = 103.1377 2.26% Inflation 2.26% T = X2 - X1 * 100 128,624 - 124,711 T = 124,711 * 100 = 3.14% Thave = [((1+1 )1in) -1] # 100 130,416 - 124,711 TU = 124,711 * 100 = 4.57% TVavg = [((1+.0457)1/2) -1] * 100 = 2.26% Economics: An Overview Chapter 9 - Slide 21 ECN550 Inflation and Unemployment1. Complete the table below, using the information and formulas provided in class 8 (see PDF document posted on Blackboard, Weekly Schedule tab, Week 8). 2. Caleulate the annual average inflation rate for the period 2000-2016 (16 years). 3. Provide one example of each calculation, and round your final results to two decimal places. Value of Annual CPI Annual CPI Annual basket Inflation index Inflation index Inflation of goods Rate 2000=100 Rate 2010=100 Rate 2002 2007 2008 2012 2013 2015 2016 790,074
Step by Step Solution
There are 3 Steps involved in it
Step: 1
Get Instant Access to Expert-Tailored Solutions
See step-by-step solutions with expert insights and AI powered tools for academic success
Step: 2
Step: 3
Ace Your Homework with AI
Get the answers you need in no time with our AI-driven, step-by-step assistance