

Answered step by step
Verified Expert Solution
Question
1 Approved Answer
Sensitivity Analysis, Discuss and interpret the results of sensitivity analysis. begin{tabular}{crrr} multicolumn{2}{c}{ S>K } hline Volatility & multicolumn{2}{c}{ Call } & multicolumn{2}{c}{ Put }
Sensitivity Analysis, Discuss and interpret the results of sensitivity analysis. 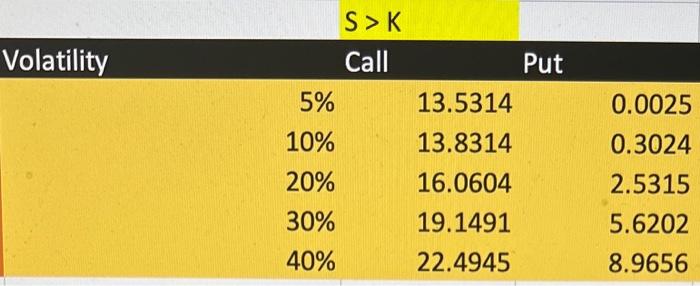
\begin{tabular}{crrr} \multicolumn{2}{c}{ S>K } \\ \hline Volatility & \multicolumn{2}{c}{ Call } & \multicolumn{2}{c}{ Put } \\ \hline 5% & 13.5314 & 0.0025 \\ & 10% & 13.8314 & 0.3024 \\ & 20% & 16.0604 & 2.5315 \\ & 30% & 19.1491 & 5.6202 \\ & 40% & 22.4945 & 8.9656 \end{tabular} Step by Step Solution
There are 3 Steps involved in it
Step: 1

Get Instant Access to Expert-Tailored Solutions
See step-by-step solutions with expert insights and AI powered tools for academic success
Step: 2

Step: 3
Ace Your Homework with AI
Get the answers you need in no time with our AI-driven, step-by-step assistance
Get Started
Short Term Financial Management
Authors: Ned C. Hill, William L. Sartoris
3rd Edition
0023548320, 978-0023548321