

Question
Separate a column To create the week_ratings data, we first selected all the columns in ratings2 that contain data about the number of 7-day viewers
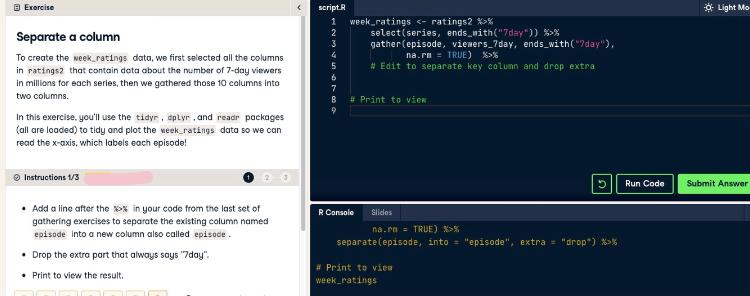
Separate a column
To create the week_ratings data, we first selected all the columns in ratings2 that contain data about the number of 7-day viewers in millions for each series, then we gathered those 10 columns into two columns.
In this exercise, you'll use the tidyr, dplyr, and readr packages (all are loaded) to tidy and plot the week_ratings data so we can read the x-axis, which labels each episode!
Instructions 1/3
- Add a line after the %>% in your code from the last set of gathering exercises to separate the existing column named episode into a new column also called episode.
- Drop the extra part that always says "7day".
- Print to view the result.
What code goes under # Edit to separate key column and drop extra
and # Print to view ? Code must be correctly typed for system to read it
Exercise -0. Light Mo script.R 1 2 3 4 5 6 7 8 week_ratings >% in your code from the last set of gathering exercises to separate the existing column named episode into a new column also called episode Drop the extra part that always says "day". Print to view the result. R Console Slides na.r = TRUE) *% separate(episode, into - "episode", extra = "drop") %>% # Print to vies week_ratingsStep by Step Solution
There are 3 Steps involved in it
Step: 1

Get Instant Access to Expert-Tailored Solutions
See step-by-step solutions with expert insights and AI powered tools for academic success
Step: 2

Step: 3
Ace Your Homework with AI
Get the answers you need in no time with our AI-driven, step-by-step assistance
Get Started
Relational Theory For Computer Professionals What Relational Databases Are Really All About
Authors: C J Date
1st Edition
1449369464, 9781449369460