

Answered step by step
Verified Expert Solution
Question
1 Approved Answer
SEQUENCES >dinD 32->52 aactgtatataaatacagtt >dinG 15->35 tattggctgtttatacagta >dinH 77->97 tcctgttaatccatacagca >dinI 19->39 acctgtataaataaccagta >lexA-1 28->48 tgctgtatatactcacagca >lexA-2 7->27 aactgtatatacacccaggg >polB(dinA) 53->73 gactgtataaaaccacagcc >recA 59->79 tactgtatgagcatacagta
SEQUENCES
>dinD 32->52 aactgtatataaatacagtt >dinG 15->35 tattggctgtttatacagta >dinH 77->97 tcctgttaatccatacagca >dinI 19->39 acctgtataaataaccagta >lexA-1 28->48 tgctgtatatactcacagca >lexA-2 7->27 aactgtatatacacccaggg >polB(dinA) 53->73 gactgtataaaaccacagcc >recA 59->79 tactgtatgagcatacagta >recN-1 49->69 tactgtatataaaaccagtt >recN-2 27->47 tactgtacacaataacagta >recN-3 9-29 TCCTGTATGAAAAACCATTA >ruvAB 49->69 cgctggatatctatccagca >sosC 18->38 tactgatgatatatacaggt >sosD 14->34 cactggatagataaccagca >sulA 22->42 tactgtacatccatacagta >umuDC 20->40 tactgtatataaaaacagta >uvrA 83->103 tactgtatattcattcaggt >uvrB 75->95 aactgtttttttatccagta >uvrD 57->77 atctgtatatatacccagct
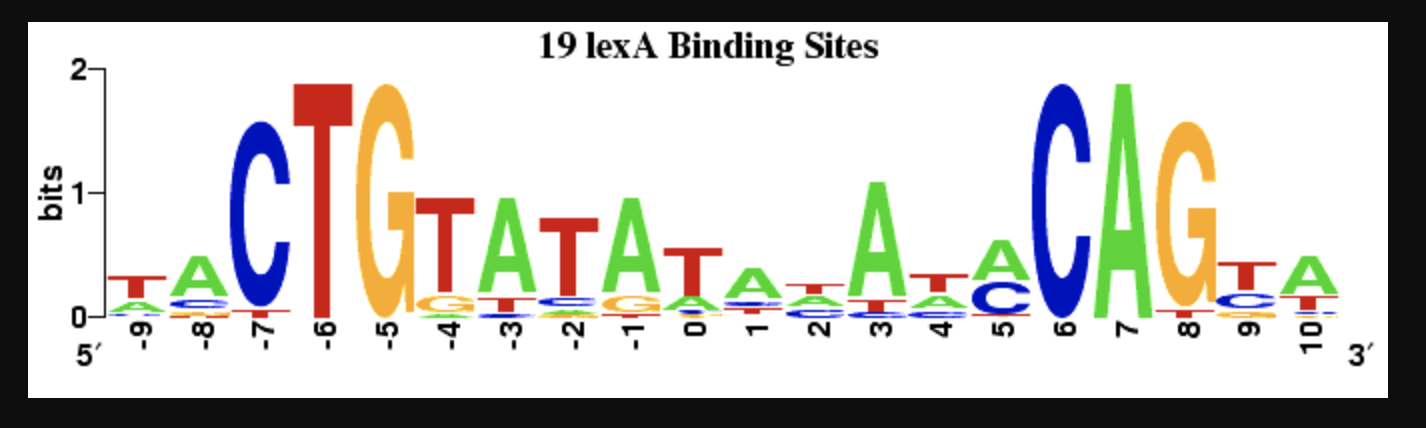
BERKELEY'S PLOT OF SEQUENCELOGO FOR SEQUENCE ABOVE.
 USE/SHOW MATLAB CODE.
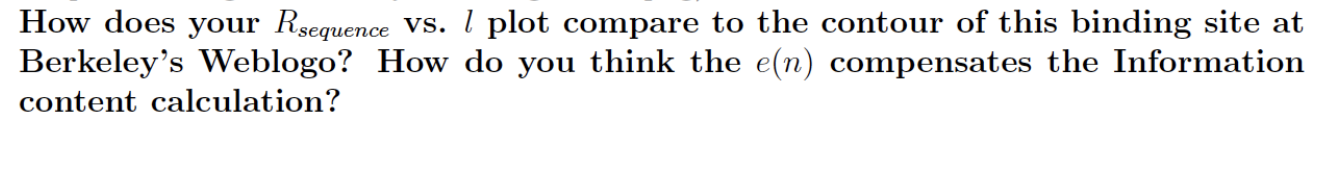
COMPARE Ri VS. l PLOT TO ABOVE SEQUENCE LOGO.
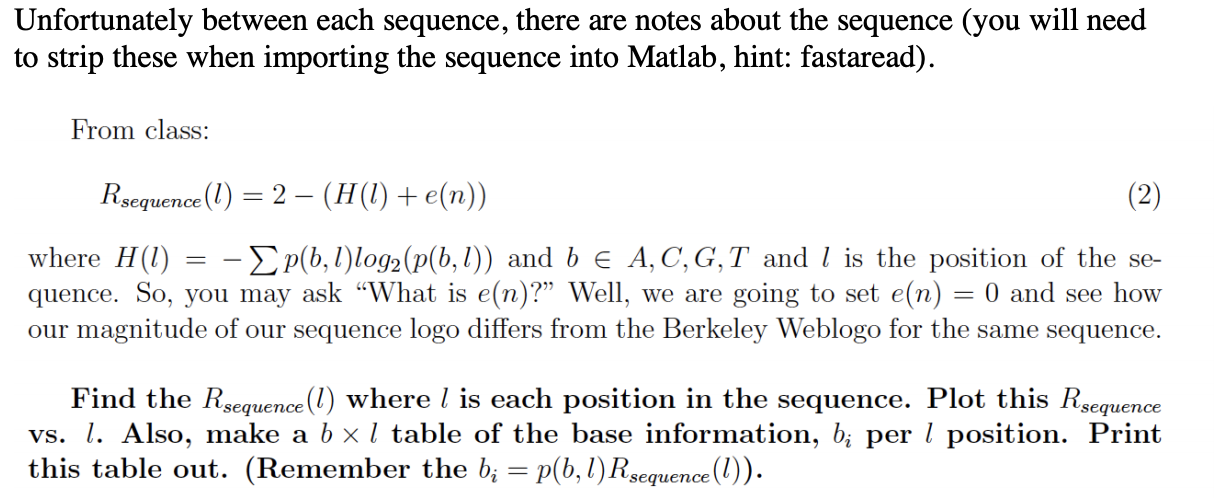
19 lexA Binding Sites bits CTGTATAre : 626CA G. Co Unfortunately between each sequence, there are notes about the sequence (you will need to strip these when importing the sequence into Matlab, hint: fastaread). From class: Rsequence (1) = 2 (H(1) + e(n)) (2) where H(1) = - p(6,1)log2(p(6,1)) and b E A, C,G,T and I is the position of the se- quence. So, you may ask "What is e(n)? Well, we are going to set e(n) = 0 and see how our magnitude of our sequence logo differs from the Berkeley Weblogo for the same sequence. Find the Rsequence(l) where l is each position in the sequence. Plot this Rsequence vs. 1. Also, make a b x1 table of the base information, bi per l position. Print this table out. (Remember the b = p(6,1)Rsequence (1)). How does your Rsequence vs. I plot compare to the contour of this binding site at Berkeley's Weblogo? How do you think the e(n) compensates the Information content calculation? 19 lexA Binding Sites bits CTGTATAre : 626CA G. Co Unfortunately between each sequence, there are notes about the sequence (you will need to strip these when importing the sequence into Matlab, hint: fastaread). From class: Rsequence (1) = 2 (H(1) + e(n)) (2) where H(1) = - p(6,1)log2(p(6,1)) and b E A, C,G,T and I is the position of the se- quence. So, you may ask "What is e(n)? Well, we are going to set e(n) = 0 and see how our magnitude of our sequence logo differs from the Berkeley Weblogo for the same sequence. Find the Rsequence(l) where l is each position in the sequence. Plot this Rsequence vs. 1. Also, make a b x1 table of the base information, bi per l position. Print this table out. (Remember the b = p(6,1)Rsequence (1)). How does your Rsequence vs. I plot compare to the contour of this binding site at Berkeley's Weblogo? How do you think the e(n) compensates the Information content calculationStep by Step Solution
There are 3 Steps involved in it
Step: 1

Get Instant Access to Expert-Tailored Solutions
See step-by-step solutions with expert insights and AI powered tools for academic success
Step: 2

Step: 3
Ace Your Homework with AI
Get the answers you need in no time with our AI-driven, step-by-step assistance
Get Started
Data Science Project Ideas In Health Care Volume 1
Authors: Zemelak Goraga
1st Edition
B0CPX2RWPF, 979-8223791072