Answered step by step
Verified Expert Solution
Link Copied!

Question

1 Approved Answer

Set up a differential equation used to model a population with logistic growth where t= time, P= the population at time t,k is the growth
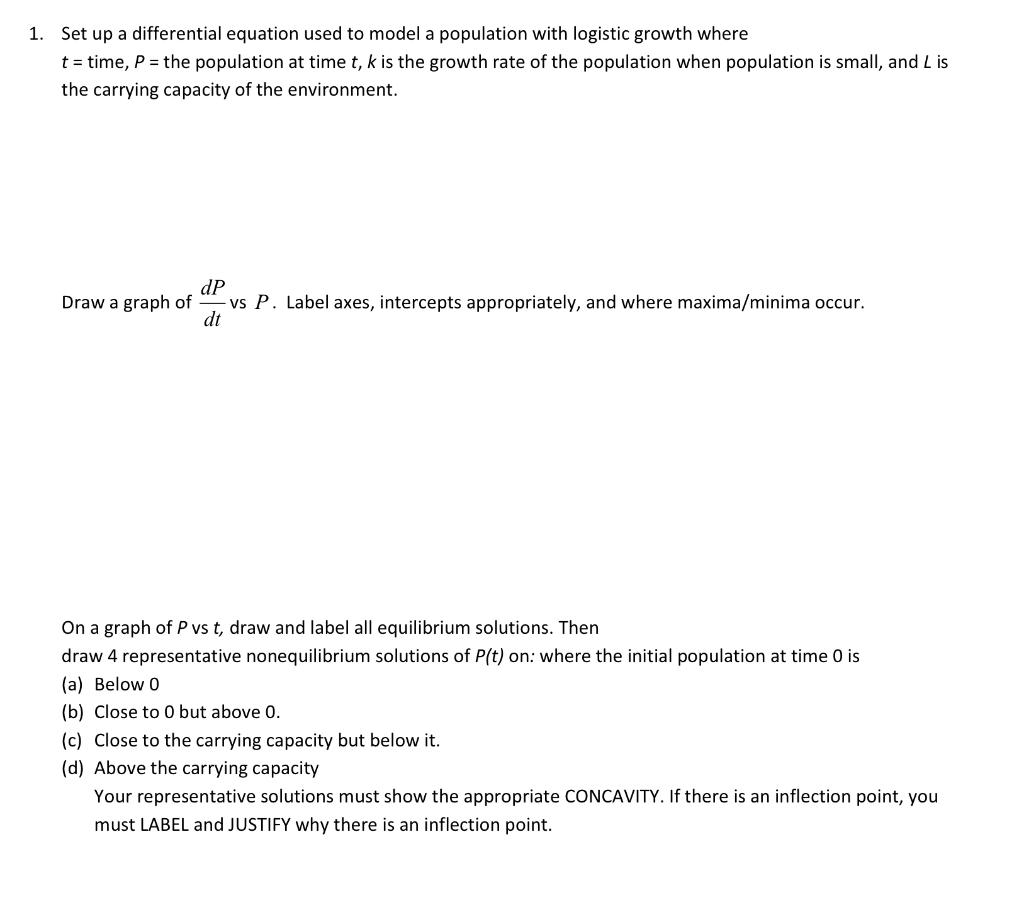
image text in transcribed

Set up a differential equation used to model a population with logistic growth where t= time, P= the population at time t,k is the growth rate of the population when population is small, and L is the carrying capacity of the environment. Draw a graph of dtdP vs P. Label axes, intercepts appropriately, and where maxima/minima occur. On a graph of P vs t, draw and label all equilibrium solutions. Then draw 4 representative nonequilibrium solutions of P(t) on: where the initial population at time 0 is (a) Below 0 (b) Close to 0 but above 0 . (c) Close to the carrying capacity but below it. (d) Above the carrying capacity Your representative solutions must show the appropriate CONCAVITY. If there is an inflection point, you must LABEL and JUSTIFY why there is an inflection point

Step by Step Solution

There are 3 Steps involved in it

Step: 1

blur-text-image

Get Instant Access to Expert-Tailored Solutions

See step-by-step solutions with expert insights and AI powered tools for academic success

Step: 2

blur-text-image

Step: 3

blur-text-image

Ace Your Homework with AI

Get the answers you need in no time with our AI-driven, step-by-step assistance

Get Started

Recommended Textbook for

Data Analytics for Accounting

Authors: Vernon Richardson

1st edition

1260375196, 9781260375183 , 978-1260375190

More Books

Students also viewed these Accounting questions