Answered step by step
Verified Expert Solution
Question
1 Approved Answer
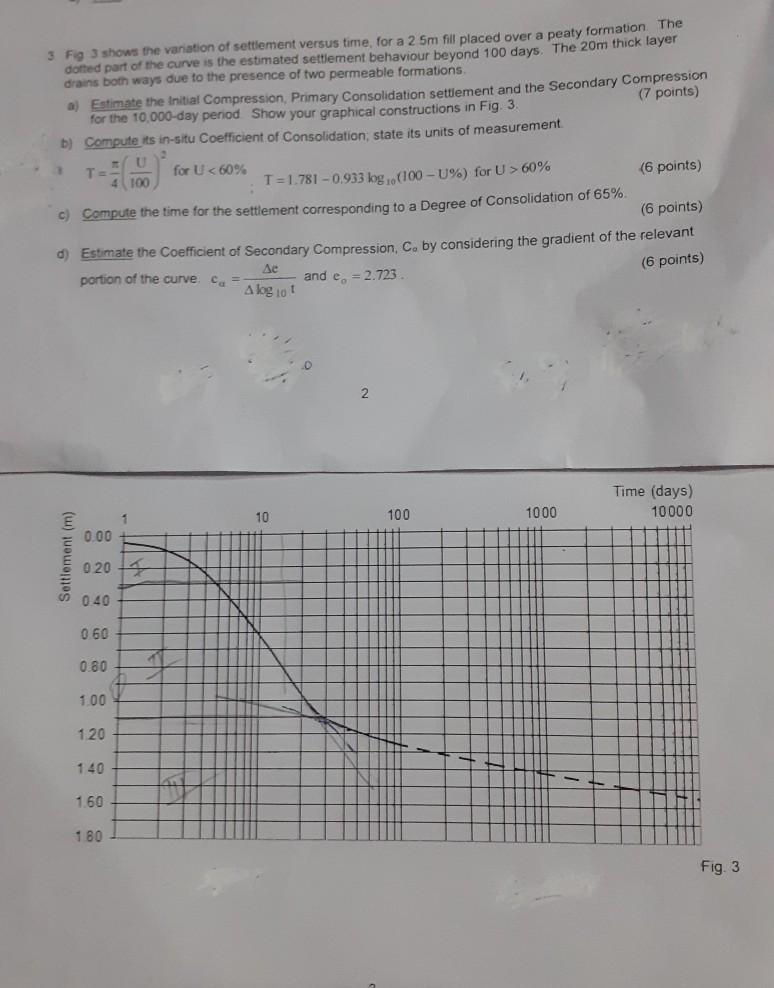
3 Fig 3 shows the variation of settlement versus time, for a 2 5m fill placed over a peaty formation The dotted part of

3 Fig 3 shows the variation of settlement versus time, for a 2 5m fill placed over a peaty formation The dotted part of the curve is the estimated settlement behaviour beyond 100 days. The 20m thick layer drains both ways due to the presence of two permeable formations. a) Estimate the Initial Compression, Primary Consolidation settlement and the Secondary Compression for the 10,000-day period Show your graphical constructions in Fig. 3. (7 points) b) Compute its in-situ Coefficient of Consolidation; state its units of measurement U for U 60% (6 points) 4 100 c) Compute the time for the settlement corresponding to a Degree of Consolidation of 65%. (6 points) d) Estimate the Coefficient of Secondary Compression, C. by considering the gradient of the relevant (6 points) Ae portion of the curve. Ca and e =2.723 A log 10t Time (days) 1 10 100 1000 10000 0.00 0 20 4 040 0 60 0.80 1.00 1.20 140 1.60 180 Fig. 3 Settlement (m)
Step by Step Solution
★★★★★
3.56 Rating (163 Votes )
There are 3 Steps involved in it
Step: 1

Get Instant Access to Expert-Tailored Solutions
See step-by-step solutions with expert insights and AI powered tools for academic success
Step: 2

Step: 3

Ace Your Homework with AI
Get the answers you need in no time with our AI-driven, step-by-step assistance
Get Started


