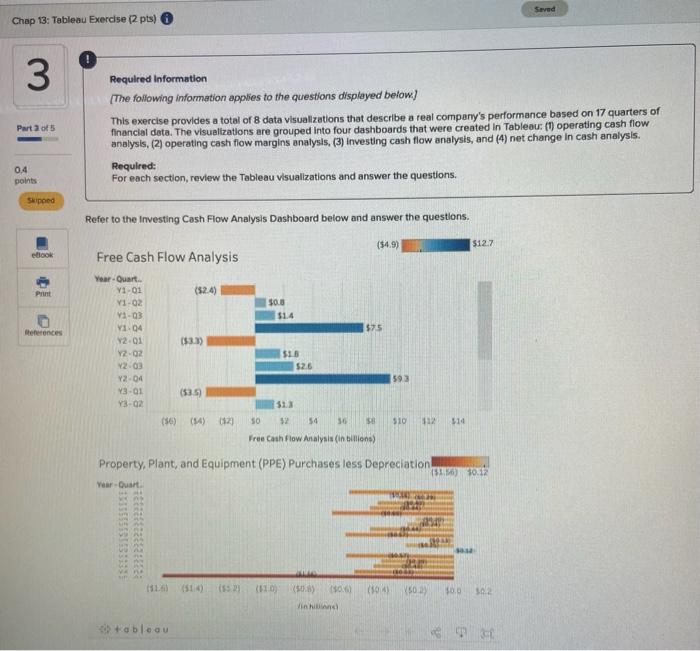
Seved Chap 13: Tableau Exercise (2 pts) 3 Part 2 of 5 Required Information The following information applies to the questions displayed below) This exercise provides a total of 8 data visualizations that describe a real company's performance based on 17 quarters of financial data. The visualizations are grouped into four dashboards that were created in Tableau: (1) operating cash flow analysis, (2) operating cash flow margins analysis, (3) Investing cash flow analysis, and (4) net change in cash analysis. Required: For each section, review the Tableau visualizations and answer the questions, 0.4 points Skipped Refer to the Investing Cash Flow Analysis Dashboard below and answer the questions. (54.9) $12.7 cook Free Cash Flow Analysis PUT (524) 30.0 $14 Berences $75 Year Quart. Y1-01 V1-02 V1-03 V1.04 Y2.01 Y2-02 V2.03 72.01 43-01 Y3-02 1933) $15 526 593 (535) (56) 012 50 52 54 30 50 510 12 110 Free Cash Flow Analysis in billions) Property, Plant, and Equipment (PPE) Purchases less Depreciation (516) 30.12 Year-Quart 15523 (510 09046 (504 V502 30.0 (508) Vinh ableau Required Information 3a. Which of the following statements are true with respect to Visualization : Free Cash Flow Analysis? (You may select more than one answer. Single click the box with the question mark to produce a check mark for a correct answer and double click the box with the question mark to empty the box for a wrong answer. Any boxes left with a question mark will be automatically graded as Incorrect.) The horizontal orange bars arise in any quarter where the free cash flow is negative. The horizontal blue bars arise in any quarter where the free cash flow is positive It begins with the first quarter of year 5 and runs consecutively and downward through the first quarter of year 1. compares net income to purchases of property, plant, and equipment on a quarterly basis. 3b. Which of the following statements are true with respect to Visualization 2: Property, Plant, and Equipment Purchases less Depreciation? (You may select more than one answer. Single click the box with the question mark to produce a check mark for a correct answer and double click the box with the question mark to empty the box for a wrong answer. Any boxes left with a question mark will be automatically graded as incorrect.) 7 The horizontal orange bars arise in any quarter where the purchases of property, plant, and equipment are greater than that quarter's depreciation charges 2 The horizontal blue bars arise in any quarter where the purchases of property, plant, and equipment are greater than that quarter's depreciation charges 7 It depicts purchases of property, plant, and equipment less depreciation charges on a year-over-year basis beginning with the first quarter of years 1-5 3c. Which of the following statements are true with respect to Visualization 1: Free Cash Flow Analysis? (You may select more than one answer. Single click the box with the question mark to produce a check mark for a correct answer and double click the box with the question mark to empty the box for a wrong answer. Any boxes left with a question mark will be automatically graded as Incorrect.) The first quarter of every year shows negative free cash flow, however, on an annual basis, the company is generating operating cash flows that for exceed its capital expenditures: 2 The fourth quarter of every year shows negative free cash flow, however on an annual basis, the company is generating operating cash flows that for exceed its capital expenditures 2 indicates that there are a total of five quarters where the free cash flow is negative 3d. Which of the following statements are true with respect to Visualization 2: Property, Plant, and Equipment Purchases less Depreciation? (You may select more than one answer. Single click the box with the question mark to produce a check mark for a correct answer and double click the box with the question mark to empty the box for a wrong answer. Any boxes left with a question mark will be automatically graded as incorrect.) 3 in 16 out of 17 quarters, the company's purchases of property, plant, and equipment are greater than its depreciation charges. in 16 out of 17 quarters, the company's purchases of property, plant, and equipment are less than its depreciation charges. ? The company's purchases of property, plant, and equipment never exceeded its depreciation charges by more than $200 million in any quarter 3. Which of the following statements are true when comparing Visualizations 1 and 2? (You may select more than one answer. Single click the box with the question mark to produce a check mark for a correct answer and double click the box with the question mark to empty the box for a wrong answer. Any boxes left with a question mark will be automatically graded as incorrect.) 2 Vaunization suggests that the company may not be investing enough mongy to maintains its noncurrent assets, however, Visualization 2 shows the company is generating suficient operating cash flows to cover its capital expenditures 2 Viscontation shows that the company is generating sufficient operating cash flows to cover its capital expenditures; however, Visualization 2 suggests the company may not be investing enough money to maintain its noncurrent assets. Visualization does not incorporate depreciation charges whereas Visualization 2 dous incorporate depreciation charges Seved Chap 13: Tableau Exercise (2 pts) 3 Part 2 of 5 Required Information The following information applies to the questions displayed below) This exercise provides a total of 8 data visualizations that describe a real company's performance based on 17 quarters of financial data. The visualizations are grouped into four dashboards that were created in Tableau: (1) operating cash flow analysis, (2) operating cash flow margins analysis, (3) Investing cash flow analysis, and (4) net change in cash analysis. Required: For each section, review the Tableau visualizations and answer the questions, 0.4 points Skipped Refer to the Investing Cash Flow Analysis Dashboard below and answer the questions. (54.9) $12.7 cook Free Cash Flow Analysis PUT (524) 30.0 $14 Berences $75 Year Quart. Y1-01 V1-02 V1-03 V1.04 Y2.01 Y2-02 V2.03 72.01 43-01 Y3-02 1933) $15 526 593 (535) (56) 012 50 52 54 30 50 510 12 110 Free Cash Flow Analysis in billions) Property, Plant, and Equipment (PPE) Purchases less Depreciation (516) 30.12 Year-Quart 15523 (510 09046 (504 V502 30.0 (508) Vinh ableau Required Information 3a. Which of the following statements are true with respect to Visualization : Free Cash Flow Analysis? (You may select more than one answer. Single click the box with the question mark to produce a check mark for a correct answer and double click the box with the question mark to empty the box for a wrong answer. Any boxes left with a question mark will be automatically graded as Incorrect.) The horizontal orange bars arise in any quarter where the free cash flow is negative. The horizontal blue bars arise in any quarter where the free cash flow is positive It begins with the first quarter of year 5 and runs consecutively and downward through the first quarter of year 1. compares net income to purchases of property, plant, and equipment on a quarterly basis. 3b. Which of the following statements are true with respect to Visualization 2: Property, Plant, and Equipment Purchases less Depreciation? (You may select more than one answer. Single click the box with the question mark to produce a check mark for a correct answer and double click the box with the question mark to empty the box for a wrong answer. Any boxes left with a question mark will be automatically graded as incorrect.) 7 The horizontal orange bars arise in any quarter where the purchases of property, plant, and equipment are greater than that quarter's depreciation charges 2 The horizontal blue bars arise in any quarter where the purchases of property, plant, and equipment are greater than that quarter's depreciation charges 7 It depicts purchases of property, plant, and equipment less depreciation charges on a year-over-year basis beginning with the first quarter of years 1-5 3c. Which of the following statements are true with respect to Visualization 1: Free Cash Flow Analysis? (You may select more than one answer. Single click the box with the question mark to produce a check mark for a correct answer and double click the box with the question mark to empty the box for a wrong answer. Any boxes left with a question mark will be automatically graded as Incorrect.) The first quarter of every year shows negative free cash flow, however, on an annual basis, the company is generating operating cash flows that for exceed its capital expenditures: 2 The fourth quarter of every year shows negative free cash flow, however on an annual basis, the company is generating operating cash flows that for exceed its capital expenditures 2 indicates that there are a total of five quarters where the free cash flow is negative 3d. Which of the following statements are true with respect to Visualization 2: Property, Plant, and Equipment Purchases less Depreciation? (You may select more than one answer. Single click the box with the question mark to produce a check mark for a correct answer and double click the box with the question mark to empty the box for a wrong answer. Any boxes left with a question mark will be automatically graded as incorrect.) 3 in 16 out of 17 quarters, the company's purchases of property, plant, and equipment are greater than its depreciation charges. in 16 out of 17 quarters, the company's purchases of property, plant, and equipment are less than its depreciation charges. ? The company's purchases of property, plant, and equipment never exceeded its depreciation charges by more than $200 million in any quarter 3. Which of the following statements are true when comparing Visualizations 1 and 2? (You may select more than one answer. Single click the box with the question mark to produce a check mark for a correct answer and double click the box with the question mark to empty the box for a wrong answer. Any boxes left with a question mark will be automatically graded as incorrect.) 2 Vaunization suggests that the company may not be investing enough mongy to maintains its noncurrent assets, however, Visualization 2 shows the company is generating suficient operating cash flows to cover its capital expenditures 2 Viscontation shows that the company is generating sufficient operating cash flows to cover its capital expenditures; however, Visualization 2 suggests the company may not be investing enough money to maintain its noncurrent assets. Visualization does not incorporate depreciation charges whereas Visualization 2 dous incorporate depreciation charges