Answered step by step
Verified Expert Solution
Question
1 Approved Answer
Several important figures are described in the Williams & Starke (2003) article you reviewed in Activity 1.2: Progress in structural materials for aerospace systems/ERAU


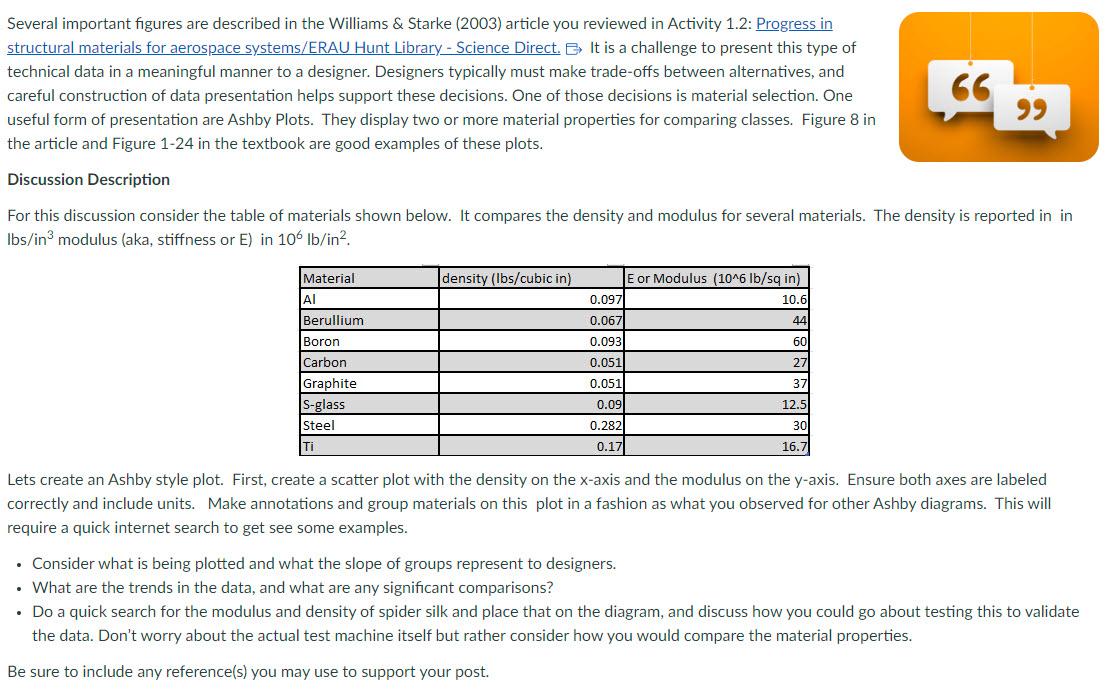
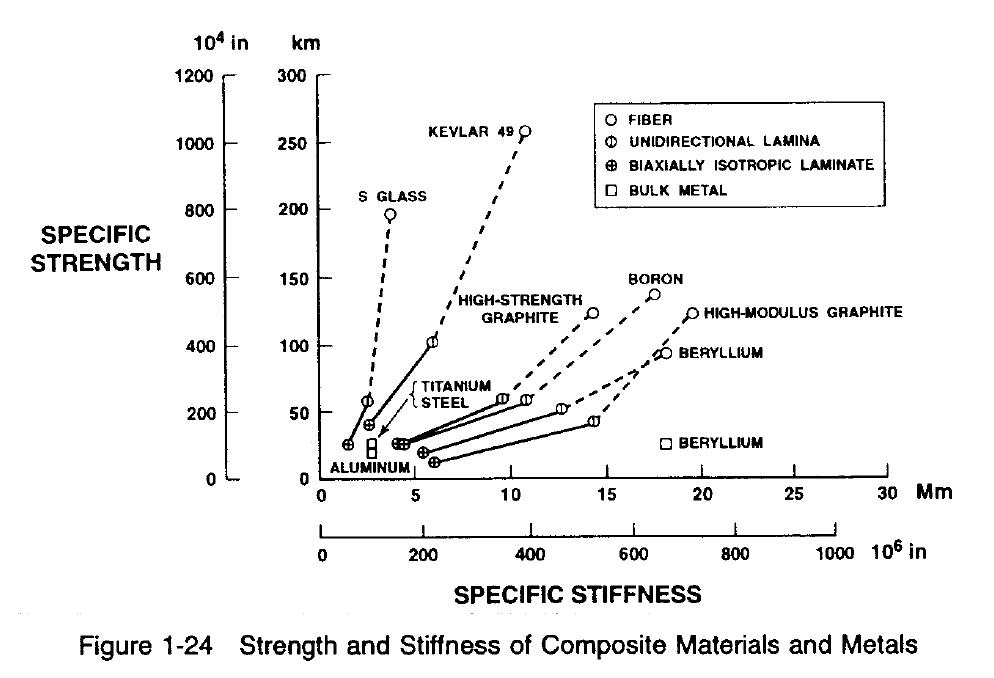
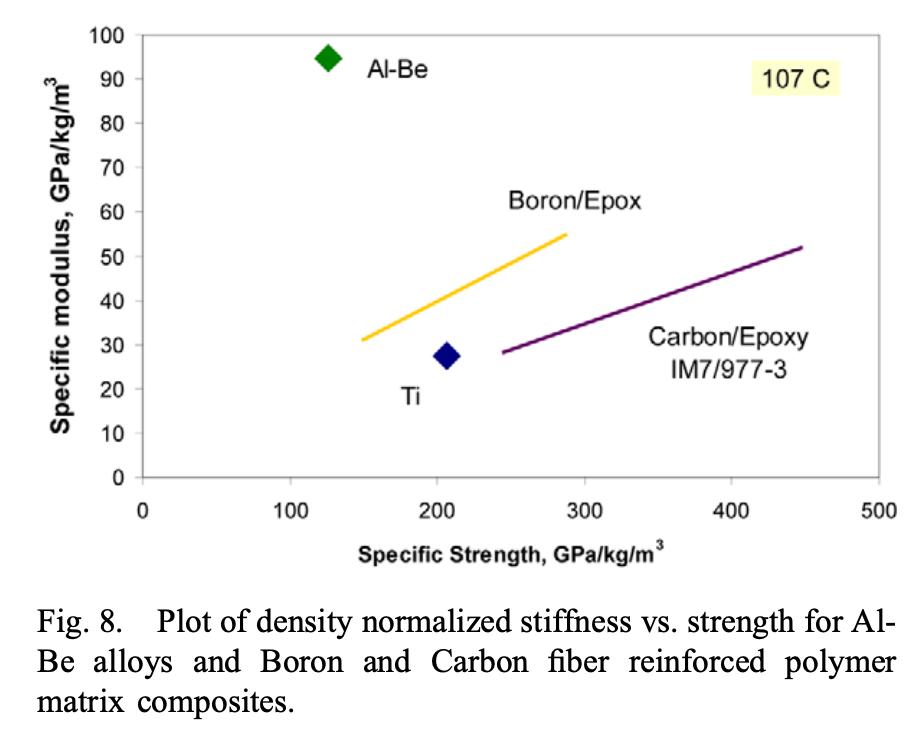
Several important figures are described in the Williams & Starke (2003) article you reviewed in Activity 1.2: Progress in structural materials for aerospace systems/ERAU Hunt Library - Science Direct. It is a challenge to present this type of technical data in a meaningful manner to a designer. Designers typically must make trade-offs between alternatives, and careful construction of data presentation helps support these decisions. One of those decisions is material selection. One useful form of presentation are Ashby Plots. They display two or more material properties for comparing classes. Figure 8 in the article and Figure 1-24 in the textbook are good examples of these plots. Discussion Description 66 99 For this discussion consider the table of materials shown below. It compares the density and modulus for several materials. The density is reported in in lbs/in modulus (aka, stiffness or E) in 106 lb/in. Material density (lbs/cubic in) E or Modulus (10^6 lb/sq in) Al 0.097 10.6 Berullium 0.067 44 Boron 0.093 60 Carbon 0.051 27 Graphite 0.051 37 S-glass 0.09 12.5 0.282 0.17 30 16.7 Steel Ti Lets create an Ashby style plot. First, create a scatter plot with the density on the x-axis and the modulus on the y-axis. Ensure both axes are labeled correctly and include units. Make annotations and group materials on this plot in a fashion as what you observed for other Ashby diagrams. This will require a quick internet search to get see some examples. Consider what is being plotted and what the slope of groups represent to designers. What are the trends in the data, and what are any significant comparisons? Do a quick search for the modulus and density of spider silk and place that on the diagram, and discuss how you could go about testing this to validate the data. Don't worry about the actual test machine itself but rather consider how you would compare the material properties. Be sure to include any reference(s) you may use to support your post. SPECIFIC 104 in 1200 km 300 1000 250 800 1 200 S GLASS STRENGTH 600 150 400 100 200 50 I KEVLAR 49 1 , FIBER UNIDIRECTIONAL LAMINA BIAXIALLY ISOTROPIC LAMINATE BULK METAL HIGH-STRENGTH GRAPHITE BORON 0 OHIGH-MODULUS GRAPHITE TITANIUM STEEL D BERYLLIUM BERYLLIUM ALUMINUM 1 1 0 0 5 10 15 20 25 30 Mm 1 0 200 400 600 800 1000 106 in SPECIFIC STIFFNESS Figure 1-24 Strength and Stiffness of Composite Materials and Metals Specific modulus, GPa/kg/m Al-Be 90 80 70 60 8 28 2854320 100 10 0 0 100 Ti 200 Boron/Epox 300 107 C Carbon/Epoxy IM7/977-3 400 500 Specific Strength, GPa/kg/m Fig. 8. Plot of density normalized stiffness vs. strength for Al- Be alloys and Boron and Carbon fiber reinforced polymer matrix composites.
Step by Step Solution
There are 3 Steps involved in it
Step: 1

Get Instant Access to Expert-Tailored Solutions
See step-by-step solutions with expert insights and AI powered tools for academic success
Step: 2

Step: 3

Ace Your Homework with AI
Get the answers you need in no time with our AI-driven, step-by-step assistance
Get Started


