Answered step by step
Verified Expert Solution
Question
1 Approved Answer
shart which which answer bost describes CPI aced on the chart GDP CQOQ 2.0% For 10 T GDP US Chained 2012 Dollars QoQ SAAR


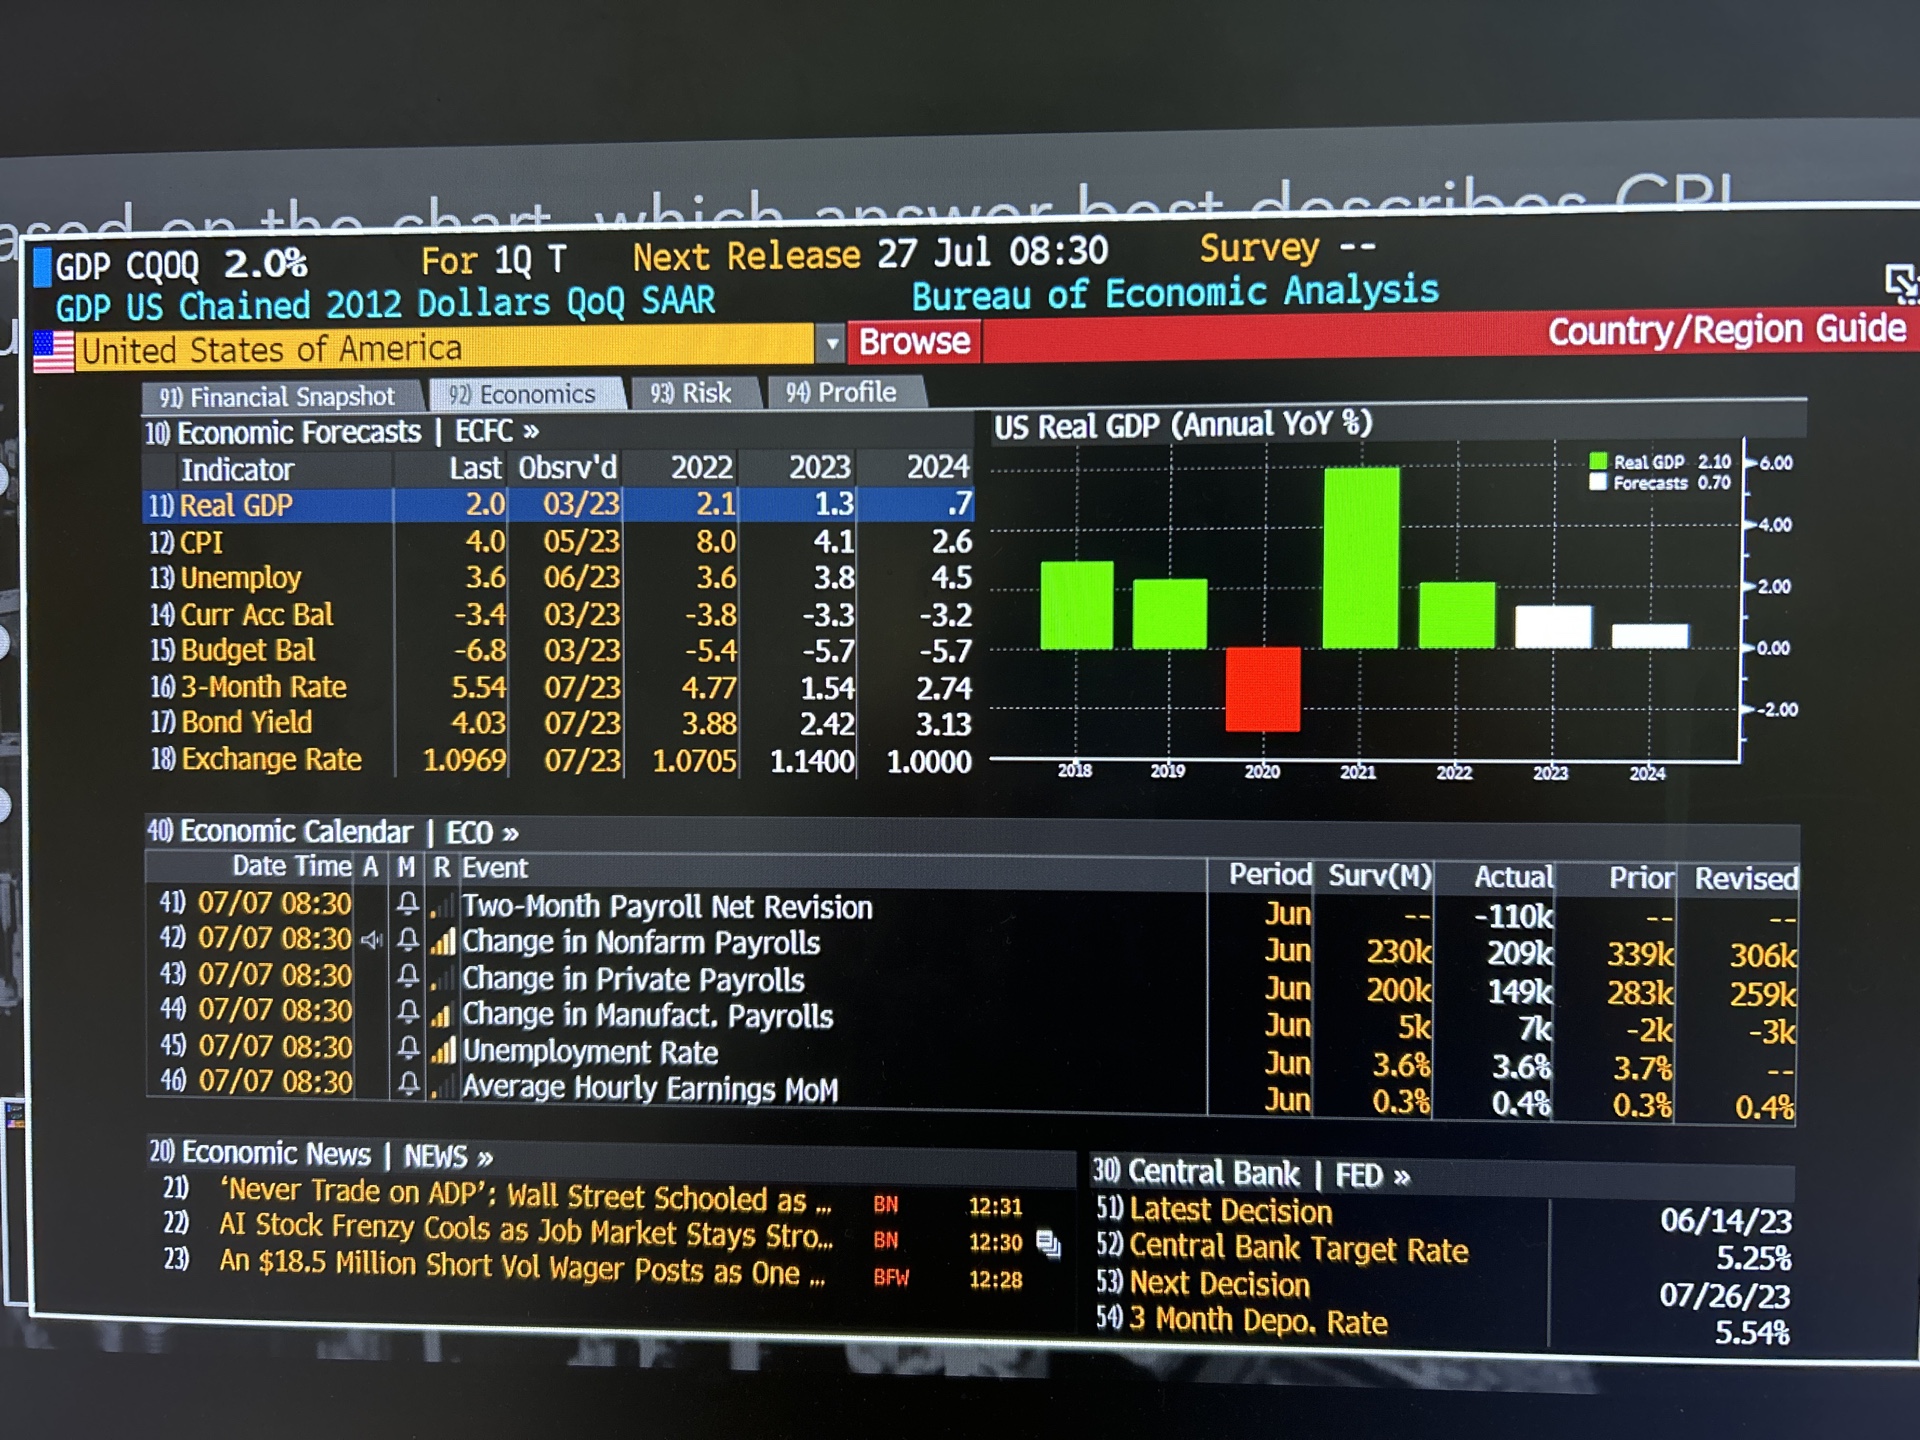
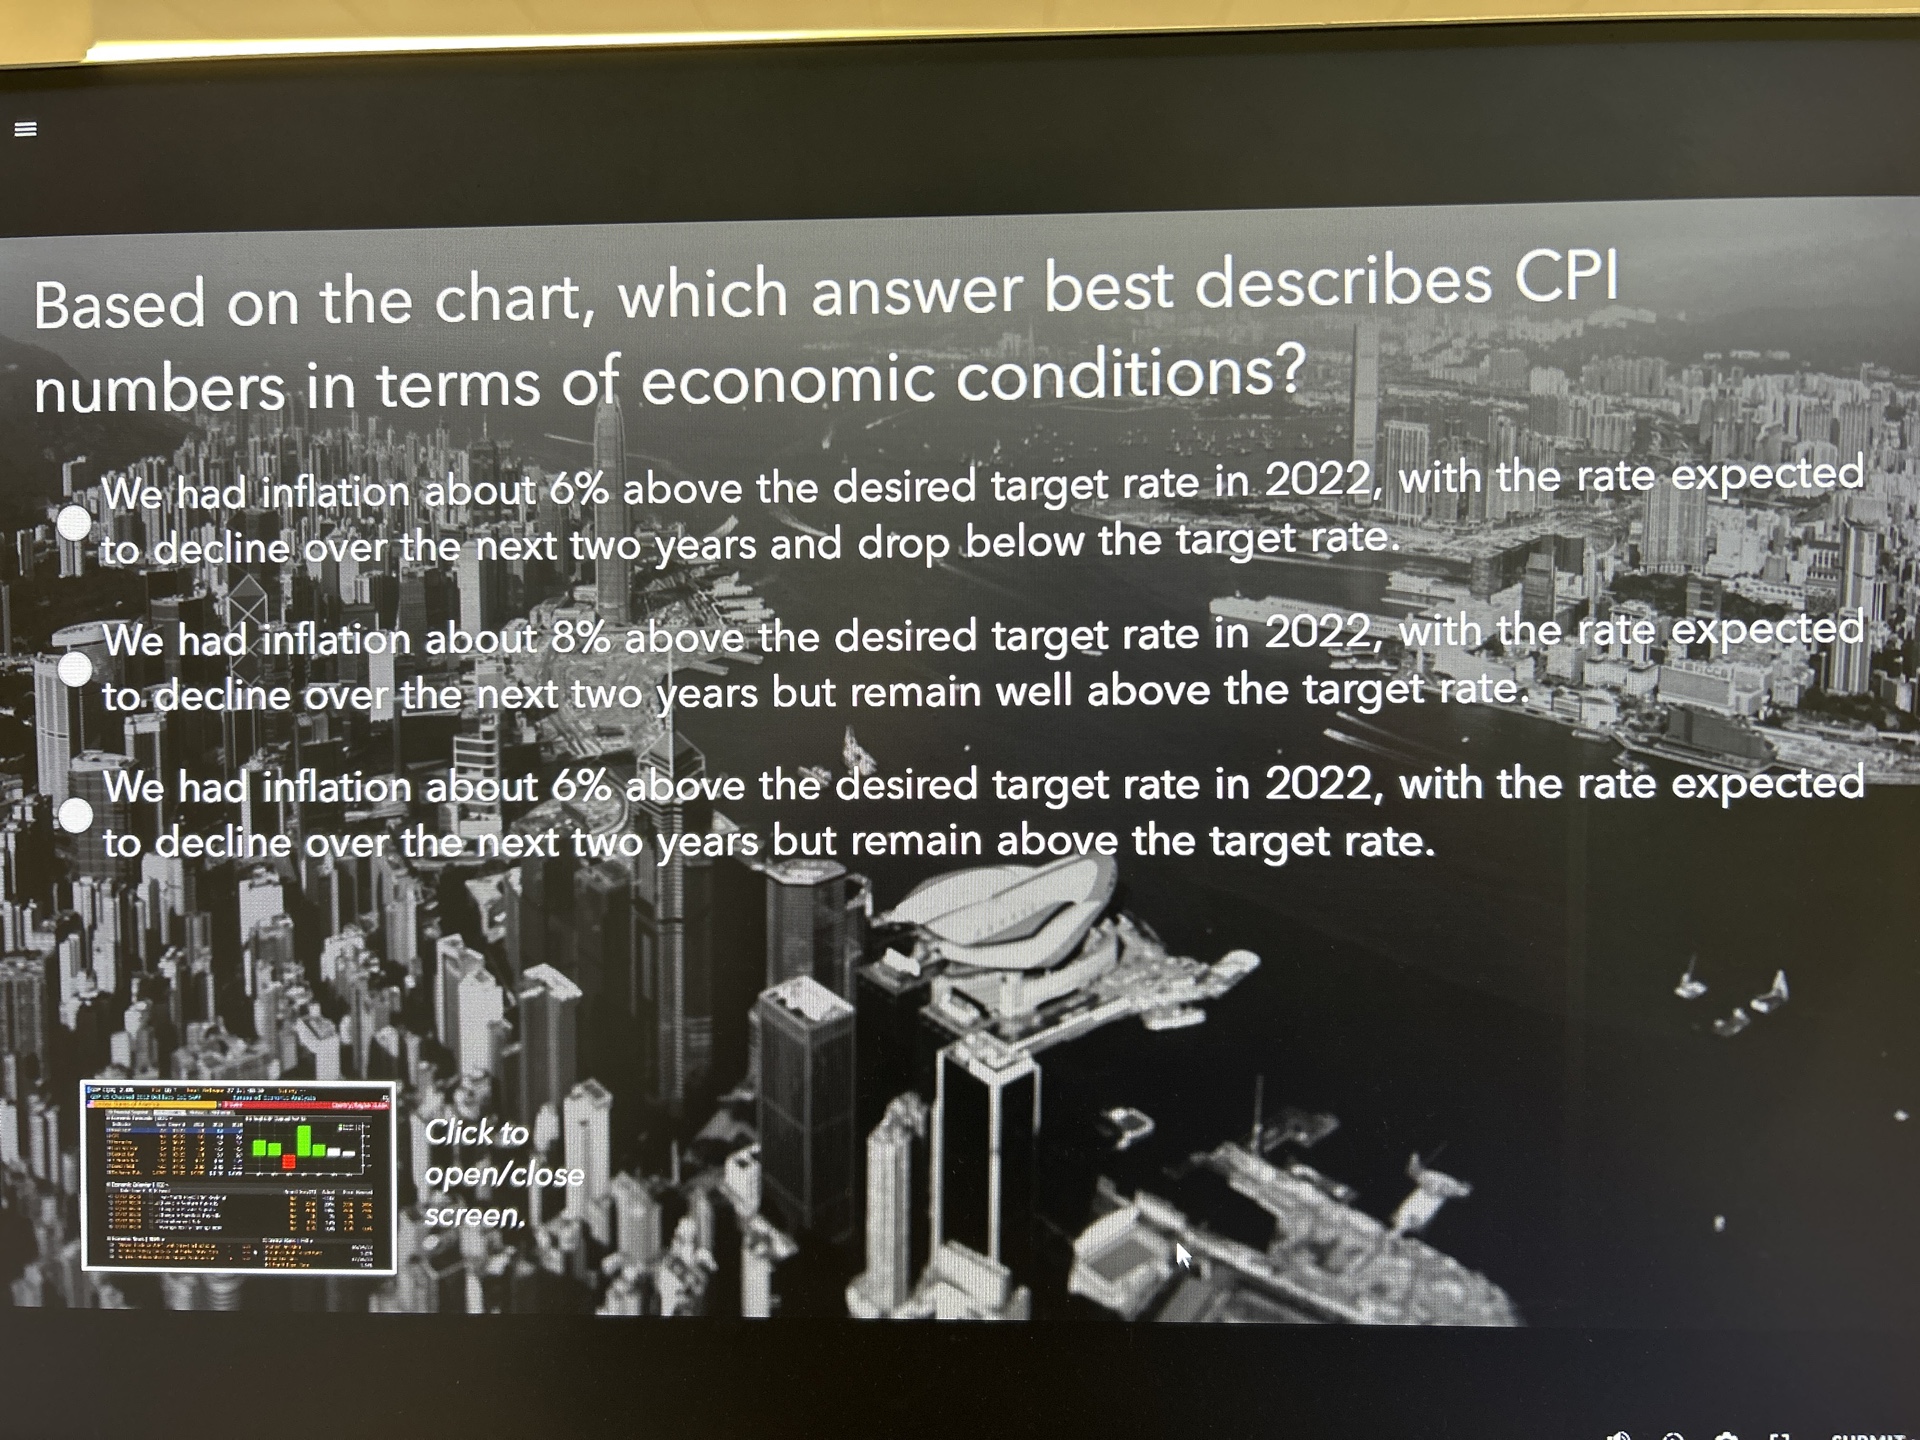
shart which which answer bost describes CPI aced on the chart GDP CQOQ 2.0% For 10 T GDP US Chained 2012 Dollars QoQ SAAR United States of America 91) Financial Snapshot 10) Economic Forecasts Indicator 11) Real GDP 12) CPI 13) Unemploy 14) Curr Acc Bal 15) Budget Bal 16) 3-Month Rate 17) Bond Yield 18) Exchange Rate 92) Economics | ECFC >> Last Obsrv'd 2.0 03/23 4.0 05/23 3.6 06/23 -3.4 03/23 -6.8 03/23 5.54 07/23 4.03 07/23 1.0969 40) Economic Calendar | ECO >> Date Time A M R Event 41) 07/07 08:30 42) 07/07 08:30 44 43) 07/07 08:30 D 44) 07/07 08:30 A 45) 07/07 08:30 46) 07/07 08:30 Survey Next Release 27 Jul 08:30 Bureau of Economic Analysis 93) Risk 2022 2.1 8.0 3.6 -3.8 -5.4 94) Profile 2023 1.3 4.1 3.8 Browse -3.3 -3.2 -5.7 -5.7 4.77 1.54 2.74 3.88 2.42 3.13 07/23 1.0705 1.1400 1.0000 4.Two-Month Payroll Net Revision Change in Nonfarm Payrolls Change in Private Payrolls Change in Manufact, Payrolls All Unemployment Rate D Average Hourly Earnings MOM B 2024 .7 2.6 4.5 20) Economic News | NEWS >> 21) 'Never Trade on ADP'; Wall Street Schooled as 22) AI Stock Frenzy Cools as Job Market Stays Stro.... 23) An $18.5 Million Short Vol Wager Posts as One... BN BN BFW US Real GDP (Annual YoY %) 12:31 12:30 12:28 2018 2019 2020 -- Jun Jun Period Surv(M) Jun Jun Jun Jun 2021 230k 200k 5k 3.6% 0.3% 2022 30) Central Bank | FED >> 51) Latest Decision 52) Central Bank Target Rate 53) Next Decision 54) 3 Month Depo. Rate N Country/Region Guide 2023 Real GDP 2.10 6.00 Forecasts 0.70 2024 -4.00 Actual -110k 209k 339k 149k 283k 7k -2k 3.6% 3.7% 0.4% 0.3% -2.00 -0.00 -2.00 Prior Revised 306k 259k -3k 0.4% 06/14/23 5.25% 07/26/23 5.54% Based on the chart, which answer best describes CPI numbers in terms of economic conditions? We had inflation about 6% above the desired target rate in 2022, with the rate expected to decline over the next two years and drop below the target rate. We had inflation about 8% above the desired target rate in 2022, with the rate expected to decline over the next two years but remain well above the target rate. We had inflation about 6% above the desired target rate in 2022, with the rate expected to decline over the next two years but remain above the target rate. 7. 27. Sany. CODE COM 12 ban 201 CHELSE I wan SORRY F 28 15 15 Y SEX SO Skaws butll 2:TAIL Settekatook WI bulboll And Fo anticco Click to open/close screen, shart which which answer bost describes CPI aced on the chart GDP CQOQ 2.0% For 10 T GDP US Chained 2012 Dollars QoQ SAAR United States of America 91) Financial Snapshot 10) Economic Forecasts Indicator 11) Real GDP 12) CPI 13) Unemploy 14) Curr Acc Bal 15) Budget Bal 16) 3-Month Rate 17) Bond Yield 18) Exchange Rate 92) Economics | ECFC >> Last Obsrv'd 2.0 03/23 4.0 05/23 3.6 06/23 -3.4 03/23 -6.8 03/23 5.54 07/23 4.03 07/23 1.0969 40) Economic Calendar | ECO >> Date Time A M R Event 41) 07/07 08:30 42) 07/07 08:30 44 43) 07/07 08:30 D 44) 07/07 08:30 A 45) 07/07 08:30 46) 07/07 08:30 Survey Next Release 27 Jul 08:30 Bureau of Economic Analysis 93) Risk 2022 2.1 8.0 3.6 -3.8 -5.4 94) Profile 2023 1.3 4.1 3.8 Browse -3.3 -3.2 -5.7 -5.7 4.77 1.54 2.74 3.88 2.42 3.13 07/23 1.0705 1.1400 1.0000 4.Two-Month Payroll Net Revision Change in Nonfarm Payrolls Change in Private Payrolls Change in Manufact, Payrolls All Unemployment Rate D Average Hourly Earnings MOM B 2024 .7 2.6 4.5 20) Economic News | NEWS >> 21) 'Never Trade on ADP'; Wall Street Schooled as 22) AI Stock Frenzy Cools as Job Market Stays Stro.... 23) An $18.5 Million Short Vol Wager Posts as One... BN BN BFW US Real GDP (Annual YoY %) 12:31 12:30 12:28 2018 2019 2020 -- Jun Jun Period Surv(M) Jun Jun Jun Jun 2021 230k 200k 5k 3.6% 0.3% 2022 30) Central Bank | FED >> 51) Latest Decision 52) Central Bank Target Rate 53) Next Decision 54)3 Month Depo. Rate N Country/Region Guide 2023 Real GDP 2.10 6.00 Forecasts 0.70 2024 -4.00 Actual -110k 209k 339k 149k 283k 7k -2k 3.6% 3.7% 0.4% 0.3% -2.00 -0.00 -2.00 Prior Revised 306k 259k -3k 0.4% 06/14/23 5.25% 07/26/23 5.54% Based on the chart, which answer best describes CPI numbers in terms of economic conditions? We had inflation about 6% above the desired target rate in 2022, with the rate expected to decline over the next two years and drop below the target rate. We had inflation about 8% above the desired target rate in 2022, with the rate expected to decline over the next two years but remain well above the target rate. We had inflation about 6% above the desired target rate in 2022, with the rate expected to decline over the next two years but remain above the target rate. 7. 27. Sany. E com 12 ban 201 CHELSE I wan SORRY F 28 15 15 Y SEX SO Skaws butll 2:TAIL Stettekatook WI bulboll And Fo anticco Click to open/close screen, shart which which answer bost describes CPI aced on the chart GDP CQOQ 2.0% For 10 T GDP US Chained 2012 Dollars QoQ SAAR United States of America 91) Financial Snapshot 10) Economic Forecasts Indicator 11) Real GDP 12) CPI 13) Unemploy 14) Curr Acc Bal 15) Budget Bal 16) 3-Month Rate 17) Bond Yield 18) Exchange Rate 92) Economics | ECFC >> Last Obsrv'd 2.0 03/23 4.0 05/23 3.6 06/23 -3.4 03/23 -6.8 03/23 5.54 07/23 4.03 07/23 1.0969 40) Economic Calendar | ECO >> Date Time A M R Event 41) 07/07 08:30 42) 07/07 08:30 44 43) 07/07 08:30 D 44) 07/07 08:30 A 45) 07/07 08:30 46) 07/07 08:30 Survey Next Release 27 Jul 08:30 Bureau of Economic Analysis 93) Risk 2022 2.1 8.0 3.6 -3.8 -5.4 94) Profile 2023 1.3 4.1 3.8 Browse -3.3 -3.2 -5.7 -5.7 4.77 1.54 2.74 3.88 2.42 3.13 07/23 1.0705 1.1400 1.0000 4.Two-Month Payroll Net Revision Change in Nonfarm Payrolls Change in Private Payrolls Change in Manufact, Payrolls All Unemployment Rate D Average Hourly Earnings MOM B 2024 .7 2.6 4.5 20) Economic News | NEWS >> 21) 'Never Trade on ADP'; Wall Street Schooled as 22) AI Stock Frenzy Cools as Job Market Stays Stro.... 23) An $18.5 Million Short Vol Wager Posts as One... BN BN BFW US Real GDP (Annual YoY %) 12:31 12:30 12:28 2018 2019 2020 -- Jun Jun Period Surv(M) Jun Jun Jun Jun 2021 230k 200k 5k 3.6% 0.3% 2022 30) Central Bank | FED >> 51) Latest Decision 52) Central Bank Target Rate 53) Next Decision 54) 3 Month Depo. Rate N Country/Region Guide 2023 Real GDP 2.10 -6.00 Forecasts 0.70 2024 -4.00 Actual -110k 209k 339k 149k 283k 7k -2k 3.6% 3.7% 0.4% 0.3% -2.00 -0.00 -2.00 Prior Revised 306k 259k -3k 0.4% 06/14/23 5.25% 07/26/23 5.54% Based on the chart, which answer best describes CPI numbers in terms of economic conditions? We had inflation about 6% above the desired target rate in 2022, with the rate expected to decline over the next two years and drop below the target rate. We had inflation about 8% above the desired target rate in 2022, with the rate expected to decline over the next two years but remain well above the target rate. We had inflation about 6% above the desired target rate in 2022, with the rate expected to decline over the next two years but remain above the target rate. 7. 27. Sany. ob Com 102 Bakn 201 CHELSE I wan SORRY F 28 15 15 Y SEX SO Skaws butll 2:TAIL Settekatook WI bulboll And Fo anticco Click to open/close screen,
Step by Step Solution
There are 3 Steps involved in it
Step: 1
The images you have shared show economic data and possible multiplechoice answers to a question regarding the Consumer Price Index CPI inflation numbe...
Get Instant Access to Expert-Tailored Solutions
See step-by-step solutions with expert insights and AI powered tools for academic success
Step: 2

Step: 3

Ace Your Homework with AI
Get the answers you need in no time with our AI-driven, step-by-step assistance
Get Started


