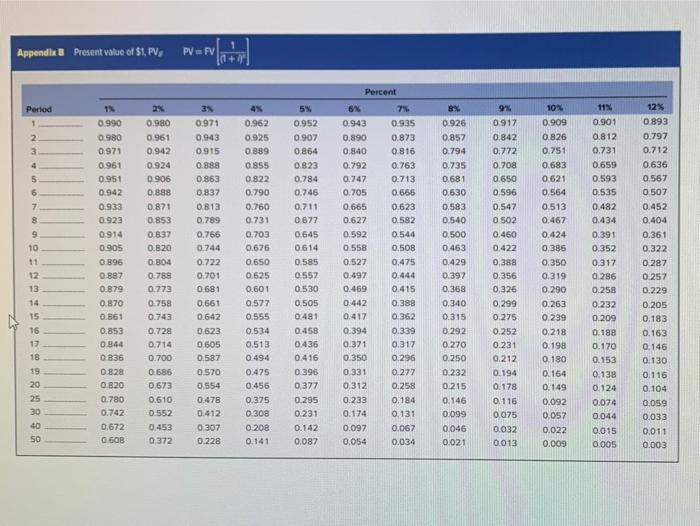
Sheila Goodman recently received her MBA from the Harvard Business School. She has joined the famay business, Goodman Software Products Inc, as Vice President of Finance She believes in adjusting projects for risk. Her father is somewhat skeptical but agrees to go along with her. Her approach is somewhat different than the risk-adjusted discount rate approach, but achieve the same objective She suggests that the inflows for each year of a project be adjusted downward for lack of certainty and then be dni.counted back at a risk-free rate. The theory is that the adjustment penalty makes the inflows the equivalent of riskless intows, and therefore and free rate is justified A table showing the possible coefficient of variation for an inflow and the associated adjustment factors show next Corriento Ajuxtent Variation Factor 0 -0.25 . 0.26 -0.50 . 8.51 -0.75 0.76 - 1.0 . 1.01 - 1.5 0.50 Assume a $170.000 project provides the following inflows with the associated coefficients of variation for each year. Coefficit 3.11 2.23 1 $19,100 256,70 3 76,6 4 64.000 5 67,200 0.14 Use Arpendix for an approximate answer but calculate your final answer using the formula and financial calculator methods e. Fil in the table below. (Do not round intermediate calculations. Round "Adjustment Factor" answers to 2 decimal places and other answers to the nearest whole dollar) Year Adjustment Factor Adjusted listow 1 2 3 4 5 Appendix & Present value of $1, PV, PVFV 12% Period 1 2. 3 4 5 6 7 8 9 10 11 0.990 0980 0.971 0.961 0.951 0.942 0.933 0.923 0914 0.905 0.896 0.887 0.879 0.870 0.861 0.853 0944 0 B36 0.82 0.820 0.780 0.742 0.672 0.60B 2x 0.980 0.961 0.942 0924 0906 0.888 0.871 0.853 0.837 0.820 0 804 0.788 0.773 0.758 0.743 0.728 0.714 0.700 0685 0.673 0.610 0.552 0.453 0372 3N 0.971 0.943 0915 0.888 0.863 0.837 0.813 0.789 0.766 0.744 0.722 0.701 0681 0.661 0.642 0.623 0505 0.587 0.570 0.554 0.478 0.412 0307 0.228 12 5% 0.952 0.907 0.864 0823 0.784 0.746 0.711 0.677 0.645 0614 0.585 0557 0.530 0.962 0.925 0.889 0855 0.822 0.790 0.760 0.731 0.703 0.676 0.650 0.625 0.601 0.577 0.555 0.534 0.513 0.494 0.475 0.456 0.375 0.308 0 208 0.141 Percent 6% 0.943 0.935 0.890 0.873 0.840 0.816 0.792 0.763 0.747 0.713 0.705 0.666 0.665 0.623 0.627 0.582 0.592 0.544 0.558 0.508 0.527 0.475 0.497 0.444 0.469 0.415 0.442 0.388 0.417 0.362 0.394 0.339 0.371 0.317 0.350 0.296 0 331 0.277 0.312 0.258 0.233 0.184 0.174 0.131 0.097 0,067 0.054 0.034 BX 0.926 0.857 0.794 0.735 0.681 0.630 0.583 0.540 0.500 0.463 0.429 0.397 0.368 0.340 0.315 0.292 0.270 0.250 0.232 0.215 0.146 0.099 0.046 0.021 9% 0917 0.842 0.772 0.708 0,650 0.596 0.547 0.502 0.460 0.422 0.388 0.356 0.326 0.299 0.275 0.252 0.231 0.212 0.194 0.178 0.116 0.075 0.032 0.013 10N 0.909 0.826 0.751 0.683 0621 0.564 0.513 0.467 0.424 0.386 0.350 0.319 0.290 0.263 0.239 0.218 0.198 0.180 0.164 0.149 0.092 0.057 0.022 0.009 11% 0.901 0.812 0.731 0.659 0.593 0.535 0.482 0.434 0.391 0.352 0.317 0.286 0.258 0.232 0.209 0.188 0.170 0.153 0.138 0.124 0.074 0.044 0.015 0.005 0.893 0.797 0.712 0.636 0.567 0.507 0.452 0.404 0.361 0.322 0.287 0.257 0.229 0.205 0.183 0.163 0.146 0.130 0.116 0.104 0.059 0.033 13 14 15 16 17 18 19 20 0.505 0.481 0.458 0.436 0.416 0.396 0.377 0.295 0.231 0.142 0.087 30 40 SO 0.011 0.003


