Answered step by step
Verified Expert Solution
Question
1 Approved Answer
Short answer graphs, models and figures. Be thorough and complete with your answers; label all graphs Consider the following monthly production functions (per month) for
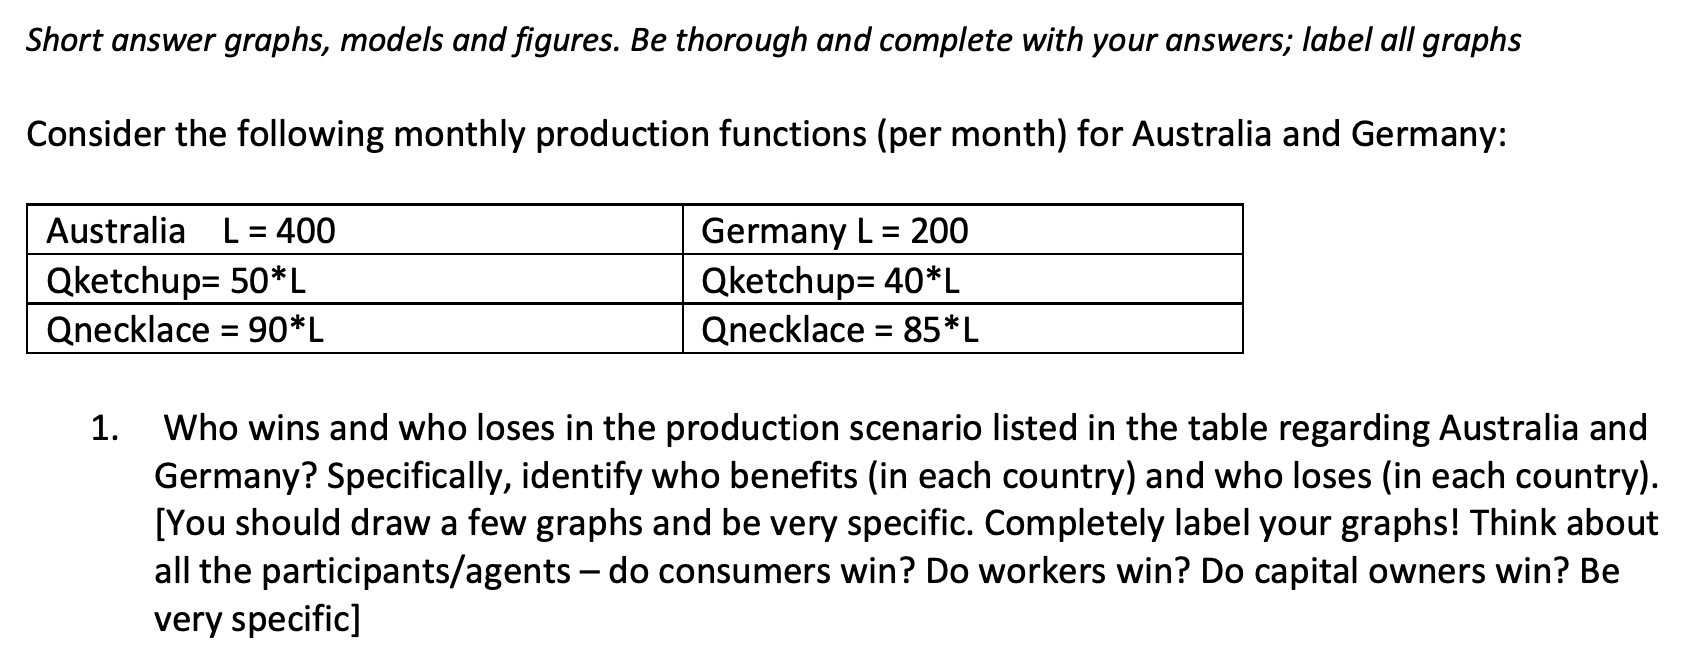
Short answer graphs, models and figures. Be thorough and complete with your answers; label all graphs Consider the following monthly production functions (per month) for Australia and Germany: Australia L = 400 Qketchup= 50*L Qnecklace = 90*L Germany L = 200 Qketchup=40*L Qnecklace = 85*L 1. Who wins and who loses in the production scenario listed in the table regarding Australia and Germany? Specifically, identify who benefits in each country) and who loses (in each country). [You should draw a few graphs and be very specific. Completely label your graphs! Think about all the participants/agents do consumers win? Do workers win? Do capital owners win? Be very specific) Short answer graphs, models and figures. Be thorough and complete with your answers; label all graphs Consider the following monthly production functions (per month) for Australia and Germany: Australia L = 400 Qketchup= 50*L Qnecklace = 90*L Germany L = 200 Qketchup=40*L Qnecklace = 85*L 1. Who wins and who loses in the production scenario listed in the table regarding Australia and Germany? Specifically, identify who benefits in each country) and who loses (in each country). [You should draw a few graphs and be very specific. Completely label your graphs! Think about all the participants/agents do consumers win? Do workers win? Do capital owners win? Be very specific)
Step by Step Solution
There are 3 Steps involved in it
Step: 1
Get Instant Access to Expert-Tailored Solutions
See step-by-step solutions with expert insights and AI powered tools for academic success
Step: 2
Step: 3
Ace Your Homework with AI
Get the answers you need in no time with our AI-driven, step-by-step assistance
Get Started