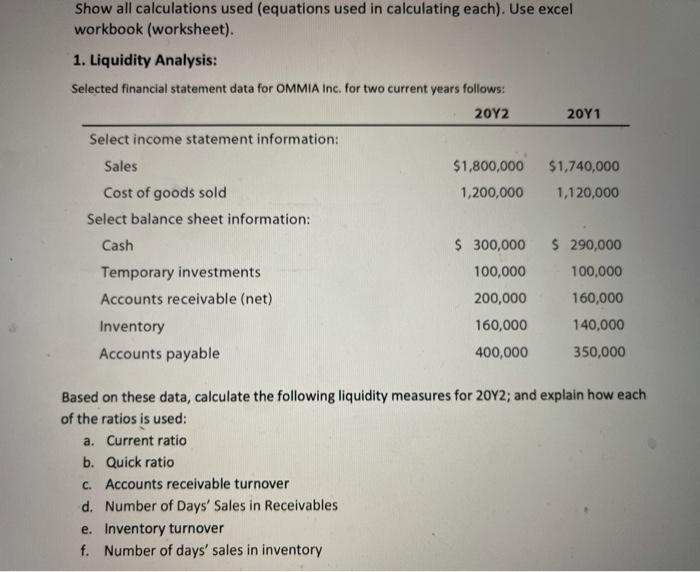
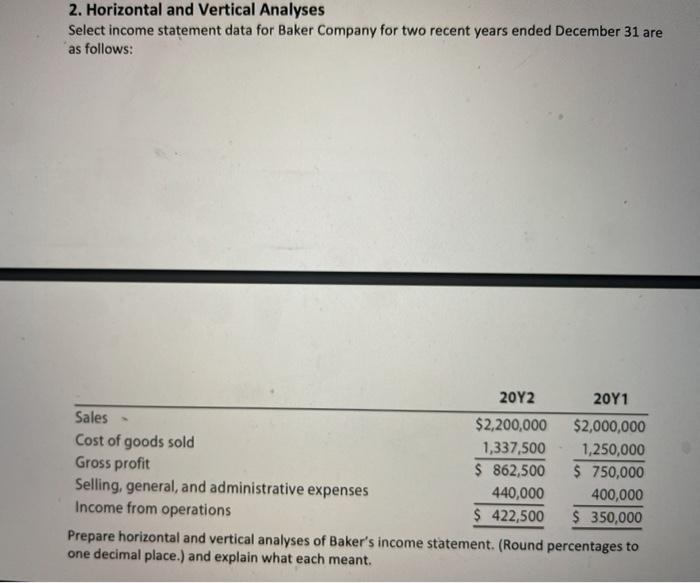
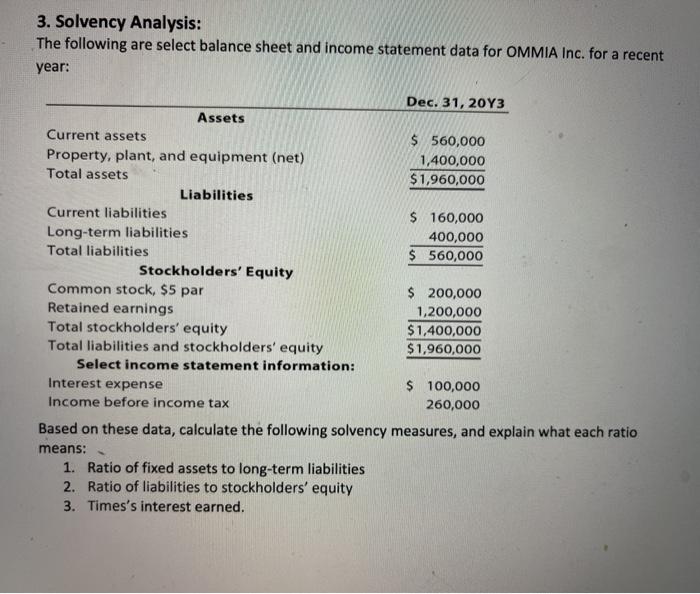
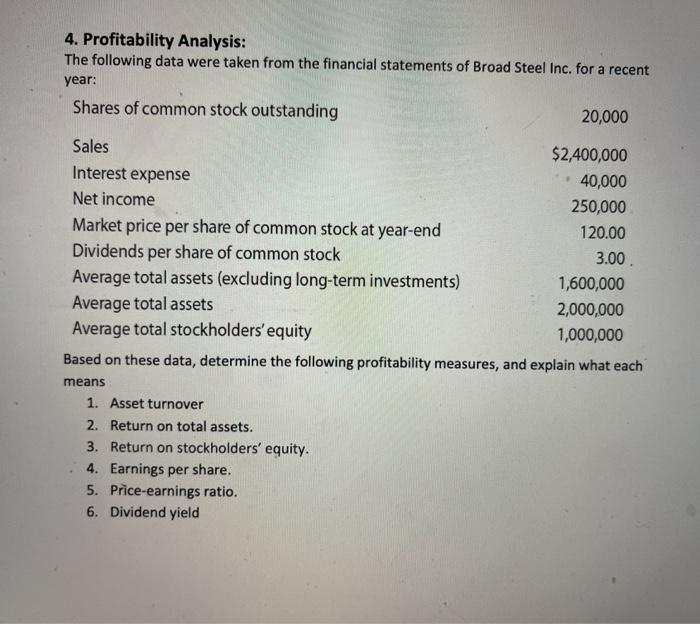
Show all calculations used (equations used in calculating each). Use excel workbook (worksheet). 1. Liquidity Analysis: Selected financial statement data for OMMIA Inc. for two current years follows: 2012 20Y1 Select income statement information: Sales $1,800,000 $1,740,000 Cost of goods sold 1,200,000 1,120,000 Select balance sheet information: Cash $ 300,000 $ 290,000 Temporary investments 100,000 100,000 Accounts receivable (net) 200,000 160,000 Inventory 160,000 140,000 Accounts payable 400,000 350,000 Based on these data, calculate the following liquidity measures for 20Y2; and explain how each of the ratios is used: a. Current ratio b. Quick ratio c. Accounts receivable turnover d. Number of Days' Sales in Receivables e. Inventory turnover f. Number of days' sales in inventory 2. Horizontal and Vertical Analyses Select income statement data for Baker Company for two recent years ended December 31 are as follows: 20Y2 20Y1 Sales- $2,200,000 $2,000,000 Cost of goods sold 1,337,500 1,250,000 Gross profit $ 862,500 $ 750,000 Selling, general, and administrative expenses 440,000 400,000 Income from operations $ 422,500 $ 350,000 Prepare horizontal and vertical analyses of Baker's income statement. (Round percentages to one decimal place.) and explain what each meant. 3. Solvency Analysis: The following are select balance sheet and income statement data for OMMIA Inc. for a recent year: Dec. 31, 20Y3 Assets Current assets $ 560,000 Property, plant, and equipment (net) 1,400,000 Total assets $1,960,000 Liabilities Current liabilities $ 160,000 Long-term liabilities 400,000 Total liabilities $ 560,000 Stockholders' Equity Common stock, $5 par $ 200,000 Retained earnings 1,200,000 Total stockholders' equity $1,400,000 Total liabilities and stockholders' equity $1,960,000 Select income statement information: Interest expense $ 100,000 Income before income tax 260,000 Based on these data, calculate the following solvency measures, and explain what each ratio means: 1. Ratio of fixed assets to long-term liabilities 2. Ratio of liabilities to stockholders' equity 3. Times's interest earned. 4. Profitability Analysis: The following data were taken from the financial statements of Broad Steel Inc. for a recent year: Shares of common stock outstanding 20,000 Sales $2,400,000 Interest expense 40,000 Net income 250,000 Market price per share of common stock at year 120.00 Dividends per share of common stock 3.00 Average total assets (excluding long-term investments) 1,600,000 Average total assets 2,000,000 Average total stockholders' equity 1,000,000 Based on these data, determine the following profitability measures, and explain what each means 1. Asset turnover 2. Return on total assets. 3. Return on stockholders' equity. 4. Earnings per share. 5. Price-earnings ratio. 6. Dividend yield