SHOW ALL EXCEL FORMULA USED
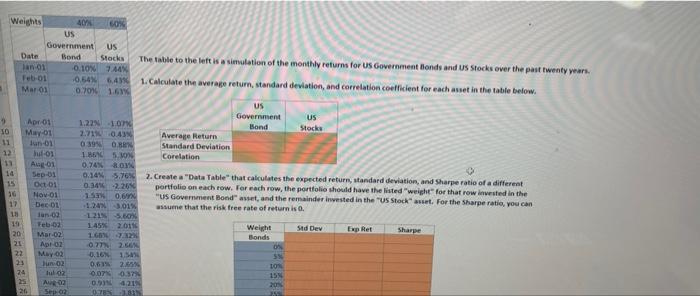
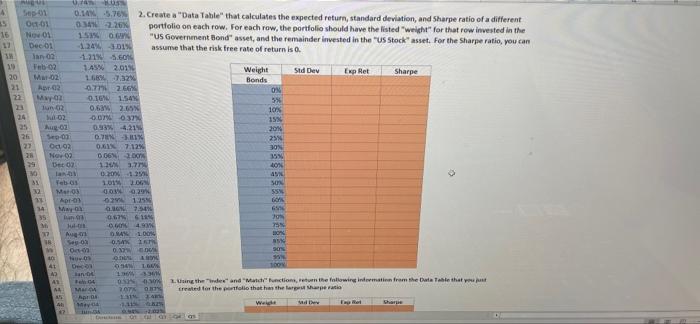
Weights 4074 60% US Government US Date Bond Stocks The table to the left is a simulation of the monthly returns for US Government Blonds and US stocks over the past twenty years. Tan 01 0.107.14% Feb-01 0.54% 6.4 1.Calculate the average return, standard deviation, and correlation coefficient for each anset in the table below. Maron 0.701 1.61 US 9 Government US Aprios 1.22NOT Bond 10 Stock May 01 2.71 0.43 Average Return 11 un-01 0 3940.BR Standard Deviation 22 03 1.05. Corelation 11 Aug 01 0.74% 14 Sep-01 0.145.76% 2. Create a "Data Table that calculates the expected return, standard deviation, and Sharpe ratio of a different 15 Oct 01 0.34-220 portfolio on each row, for each row, the portfolio should have the listed "weight for that row invested in the 16 Nov 01 15 0.67 "US Government Bonds, and the remainder invested in the US stock asset. For the Sharpe ratio, you can Dec 01 1.24 3.01% assume that the risk free rate of return is 0. 18 lun og 21.6 10 Feb-02 145 2011 Weight Std Dev Exp Ret Sharpe 20 Mar 02 16724 Bonds 21 A 02 027 2.66N OS 22 May 02 0.16 1.5 23 Jun 02 0.61 2 24 lulo 0.00371 15 25 AR 09421 20N 26 Sepo 07 5 SRDCE Sep 01 0.145.76% 2. Create a "Data Table that calculates the expected return, standard deviation, and Sharpe ratio of a different 35 04-01 0349226 portfolio on each row. For each row, the portfolio should have the listed weight for that row invested in the 16 No. 01 1510 "US Government Bond asset, and the remainder invested in the US Stock asset. For the Sharpe ratio, you can Dec 01 1.249301 assume that the risk free rate of return is. in 02 1.215.60 Feb 02 1ASX 2.016 Weight M-02 Sid Dev Exp Ret Sharpe 20 166% 7.3% Bonds 2.66% ON Mwa 0.16 1:54 3% 0.63% 2.65 100% 02 -0.07% 0.37% 15% Aug 02 0.93% 4.21 2014 26 S-02 D1% 25 O12 0.61 7.12% 30N Nowo 006200 159 Det 02 1.343.77 LON VO 2012 31 Yabas 101206 SON Meros 009 55 Apr-03 021255 GO 14 a. 25 35 0.6761 4. Aug OMA 1.00 mon Seos 0. om son 41 LON 1394 30 2.tangthened and Made Functions, return the following in from the Data Table that 20TKO created for the follo that has the traperi 1511 Welce Do AL 03 03 -0.607% -4.93% 75% 0.84% 1.00% 80% 03 40.54% 2.67% 8594 1.03 0.32% 0.06% 90% ov.03 -0.06% 4.39% 959 Becos -0.94% 1.66% 100X Tan-na 196% 3.369 Feb OA 0.52% 0,20% 3. Using the "Index" and "Match functions, return the following information from the Data Table that you just Mat-04 2.07% 0.87% created for the portfolio that has the largest Sharpe ratio -131 2.49 May 0 1.41% 0.82% Weight Std Dev Exp Ret Sharpe Iun 04 0.342.02 1-04 0.21 2.1194 Aug- 0.14%DOBN Sep-04 05149596 Si O 04 0279 0.01% 52 HONDA 02 1.53 Decot 255602 3.530 fus 95 05 MOOT. 91910 Agt-34 15 Weights 4074 60% US Government US Date Bond Stocks The table to the left is a simulation of the monthly returns for US Government Blonds and US stocks over the past twenty years. Tan 01 0.107.14% Feb-01 0.54% 6.4 1.Calculate the average return, standard deviation, and correlation coefficient for each anset in the table below. Maron 0.701 1.61 US 9 Government US Aprios 1.22NOT Bond 10 Stock May 01 2.71 0.43 Average Return 11 un-01 0 3940.BR Standard Deviation 22 03 1.05. Corelation 11 Aug 01 0.74% 14 Sep-01 0.145.76% 2. Create a "Data Table that calculates the expected return, standard deviation, and Sharpe ratio of a different 15 Oct 01 0.34-220 portfolio on each row, for each row, the portfolio should have the listed "weight for that row invested in the 16 Nov 01 15 0.67 "US Government Bonds, and the remainder invested in the US stock asset. For the Sharpe ratio, you can Dec 01 1.24 3.01% assume that the risk free rate of return is 0. 18 lun og 21.6 10 Feb-02 145 2011 Weight Std Dev Exp Ret Sharpe 20 Mar 02 16724 Bonds 21 A 02 027 2.66N OS 22 May 02 0.16 1.5 23 Jun 02 0.61 2 24 lulo 0.00371 15 25 AR 09421 20N 26 Sepo 07 5 SRDCE Sep 01 0.145.76% 2. Create a "Data Table that calculates the expected return, standard deviation, and Sharpe ratio of a different 35 04-01 0349226 portfolio on each row. For each row, the portfolio should have the listed weight for that row invested in the 16 No. 01 1510 "US Government Bond asset, and the remainder invested in the US Stock asset. For the Sharpe ratio, you can Dec 01 1.249301 assume that the risk free rate of return is. in 02 1.215.60 Feb 02 1ASX 2.016 Weight M-02 Sid Dev Exp Ret Sharpe 20 166% 7.3% Bonds 2.66% ON Mwa 0.16 1:54 3% 0.63% 2.65 100% 02 -0.07% 0.37% 15% Aug 02 0.93% 4.21 2014 26 S-02 D1% 25 O12 0.61 7.12% 30N Nowo 006200 159 Det 02 1.343.77 LON VO 2012 31 Yabas 101206 SON Meros 009 55 Apr-03 021255 GO 14 a. 25 35 0.6761 4. Aug OMA 1.00 mon Seos 0. om son 41 LON 1394 30 2.tangthened and Made Functions, return the following in from the Data Table that 20TKO created for the follo that has the traperi 1511 Welce Do AL 03 03 -0.607% -4.93% 75% 0.84% 1.00% 80% 03 40.54% 2.67% 8594 1.03 0.32% 0.06% 90% ov.03 -0.06% 4.39% 959 Becos -0.94% 1.66% 100X Tan-na 196% 3.369 Feb OA 0.52% 0,20% 3. Using the "Index" and "Match functions, return the following information from the Data Table that you just Mat-04 2.07% 0.87% created for the portfolio that has the largest Sharpe ratio -131 2.49 May 0 1.41% 0.82% Weight Std Dev Exp Ret Sharpe Iun 04 0.342.02 1-04 0.21 2.1194 Aug- 0.14%DOBN Sep-04 05149596 Si O 04 0279 0.01% 52 HONDA 02 1.53 Decot 255602 3.530 fus 95 05 MOOT. 91910 Agt-34 15


