Show all work for each question. 1. Would you use primary or secondary data in each situation? Explain. a) To determine the percentage of fellow
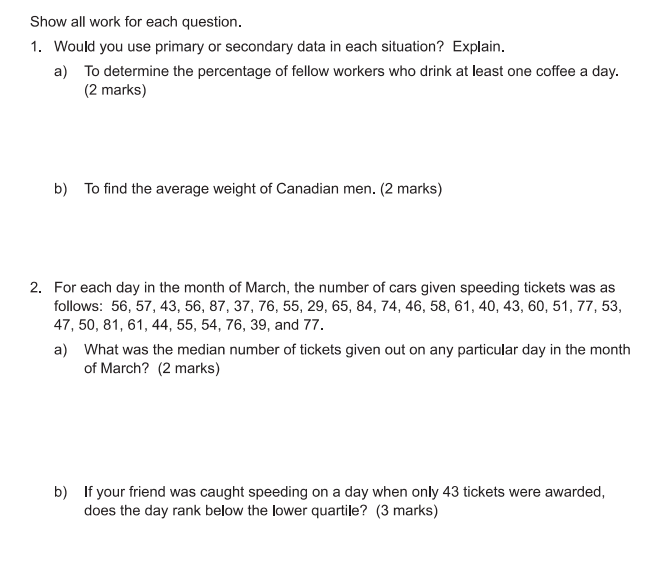
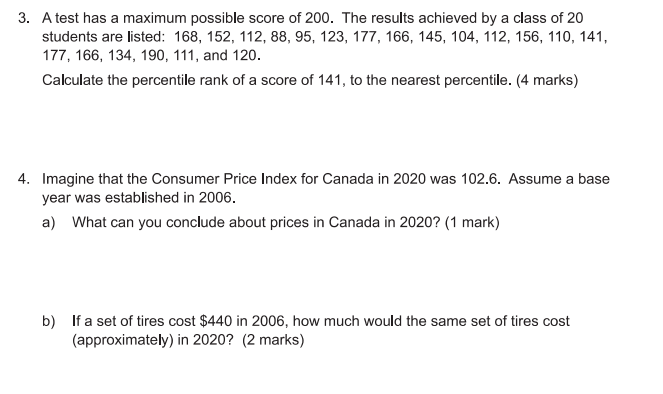
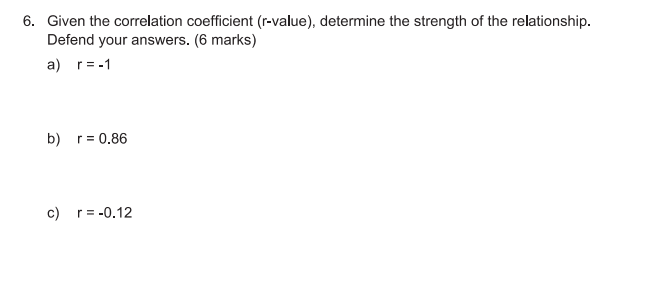
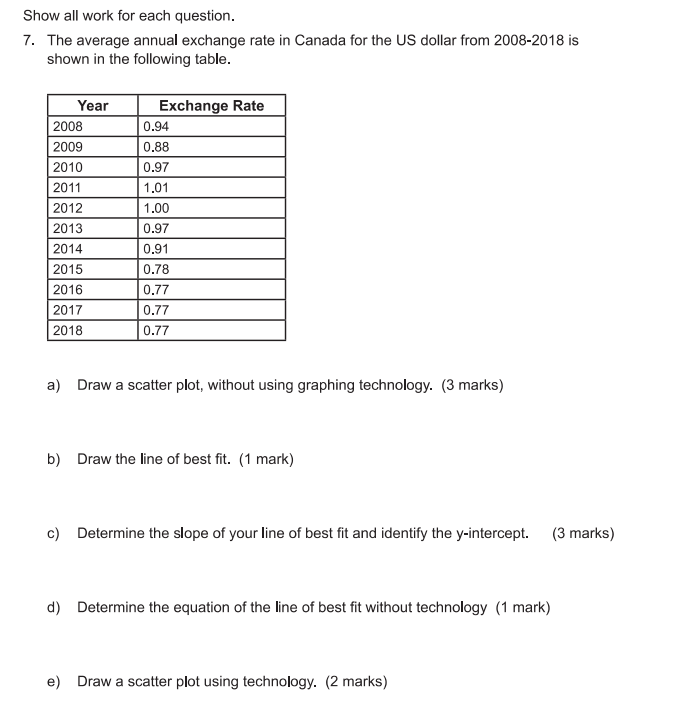
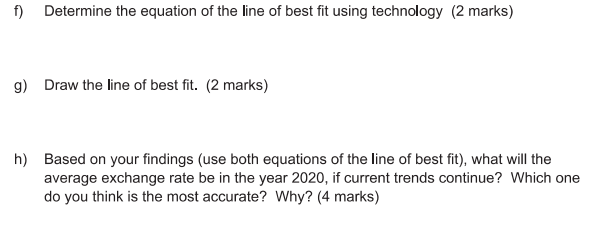
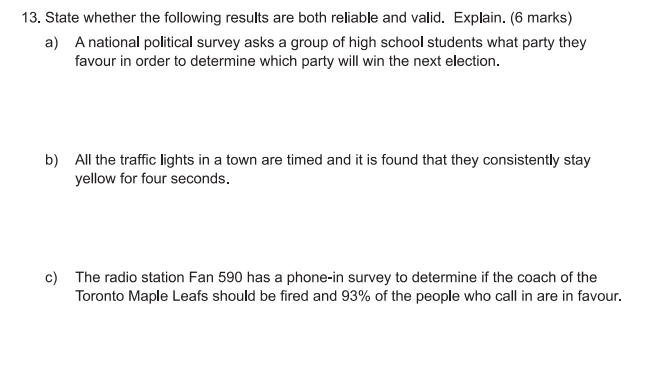
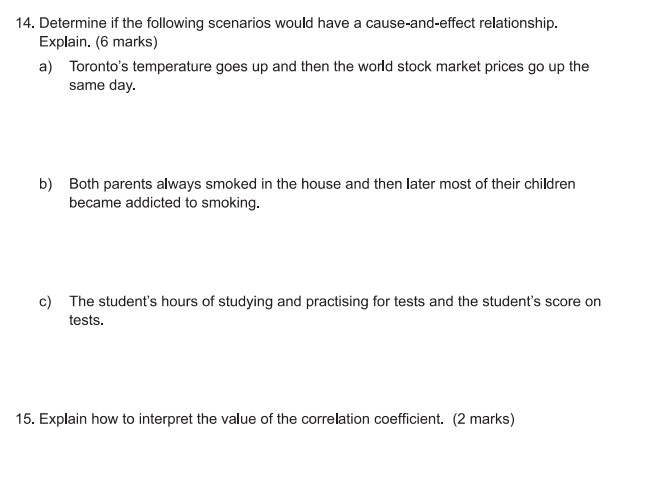
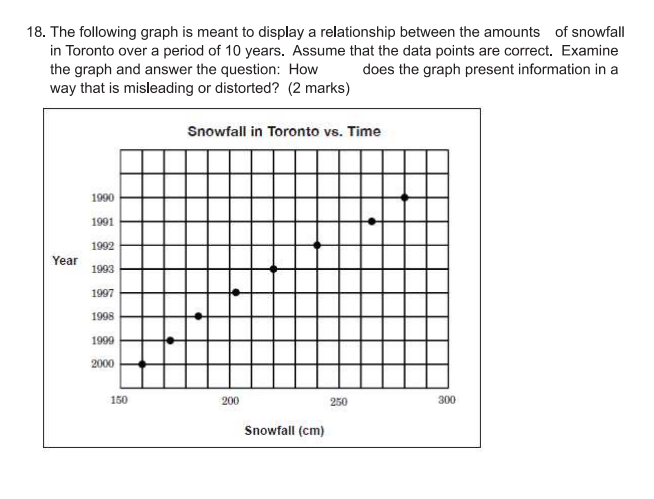
Show all work for each question. 1. Would you use primary or secondary data in each situation? Explain. a) To determine the percentage of fellow workers who drink at least one coffee a day. (2 marks) b) To find the average weight of Canadian men. (2 marks) 2. For each day in the month of March, the number of cars given speeding tickets was as follows: 56, 57, 43, 56, 87, 37, 76, 55, 29, 65, 84, 74, 46, 58, 61, 40, 43, 60, 51, 77, 53, 47, 50, 81, 61, 44, 55, 54, 76, 39, and 77. a) What was the median number of tickets given out on any particular day in the month of March? (2 marks) b) If your friend was caught speeding on a day when only 43 tickets were awarded, does the day rank below the lower quartile? (3 marks)3. A test has a maximum possible score of 200. The results achieved by a class of 20 students are listed: 168, 152, 112, 88, 95, 123, 177, 166, 145, 104, 112, 156, 110, 141, 177, 166, 134, 190, 111, and 120. Calculate the percentile rank of a score of 141, to the nearest percentile. (4 marks) 4. Imagine that the Consumer Price Index for Canada in 2020 was 102.6. Assume a base year was established in 2006. a) What can you conclude about prices in Canada in 2020? (1 mark) b) If a set of tires cost $440 in 2006, how much would the same set of tires cost (approximately) in 2020? (2 marks)6. Given the correlation coefficient (r-value), determine the strength of the relationship. Defend your answers. (6 marks) a) r=-1 b) r = 0.86 c) r=-0.12Show all work for each question. 7. The average annual exchange rate in Canada for the US dollar from 2008-2018 is shown in the following table. Year Exchange Rate 2008 0.94 2009 0.88 2010 0.97 2011 1.01 2012 1.00 2013 0.97 2014 0.91 2015 0.78 2016 0.77 2017 0.77 2018 0.77 a) Draw a scatter plot, without using graphing technology. (3 marks) b) Draw the line of best fit. (1 mark) c) Determine the slope of your line of best fit and identify the y-intercept. (3 marks) d) Determine the equation of the line of best fit without technology (1 mark) e) Draw a scatter plot using technology. (2 marks)f) Determine the equation of the line of best fit using technology (2 marks) g) Draw the line of best fit. (2 marks) h) Based on your findings (use both equations of the line of best fit), what will the average exchange rate be in the year 2020, if current trends continue? Which one do you think is the most accurate? Why? (4 marks)10. Identify the population in each of the following data collection scenarios. (2 marks) a) A school wants to know what type of music to play at the next Grade 8 dance.b) The Ministry of Education wants to know how people feel about the ILC course they have taken.11. When graphing one-variable date, is the frequency the dependent er the independent 1variable?\" {1 mark] 13. State whether the following results are both reliable and valid. Explain. (6 marks) a) A national political survey asks a group of high school students what party they favour in order to determine which party will win the next election. b) All the traffic lights in a town are timed and it is found that they consistently stay yellow for four seconds. c) The radio station Fan 590 has a phone-in survey to determine if the coach of the Toronto Maple Leafs should be fired and 93% of the people who call in are in favour.14. Determine if the following scenarios would have a cause-and-effect relationship. Explain. (6 marks) a) Toronto's temperature goes up and then the world stock market prices go up the same day. b) Both parents always smoked in the house and then later most of their children became addicted to smoking. c) The student's hours of studying and practising for tests and the student's score on tests. 15. Explain how to interpret the value of the correlation coefficient. (2 marks)18. The following graph is meant to display a relationship between the amounts of snowfall in Toronto over a period of 10 years. Assume that the data points are correct. Examine the graph and answer the question: How does the graph present information in a way that is misleading or distorted? (2 marks) Snowfall in Toronto vs. Time 1990 1991 1992 Year 1993 1997 1998 1909 2000 150 200 250 300 Snowfall (cm)
Step by Step Solution
There are 3 Steps involved in it
Step: 1
Get Instant Access to Expert-Tailored Solutions
See step-by-step solutions with expert insights and AI powered tools for academic success
Step: 2
Step: 3
Ace Your Homework with AI
Get the answers you need in no time with our AI-driven, step-by-step assistance