Answered step by step
Verified Expert Solution
Question
1 Approved Answer
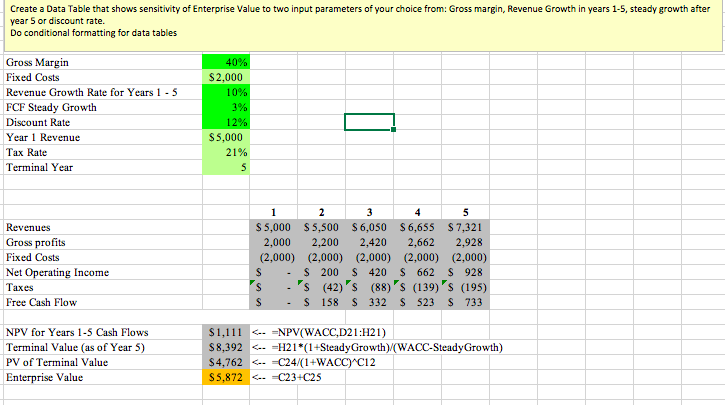
show all work in excel, please! Assignment: Create a Data Table that shows sensitivity of Enterprise Value to two input parameters of your choice from:
show all work in excel, please!
Assignment: Create a Data Table that shows sensitivity of Enterprise Value to two input parameters of your choice from: Gross margin, Revenue Growth in years 1-5, steady growth after year 5 or discount rate.
Do conditional formatting for data tables

Step by Step Solution
There are 3 Steps involved in it
Step: 1

Get Instant Access to Expert-Tailored Solutions
See step-by-step solutions with expert insights and AI powered tools for academic success
Step: 2

Step: 3

Ace Your Homework with AI
Get the answers you need in no time with our AI-driven, step-by-step assistance
Get Started


