Answered step by step
Verified Expert Solution
Question
1 Approved Answer
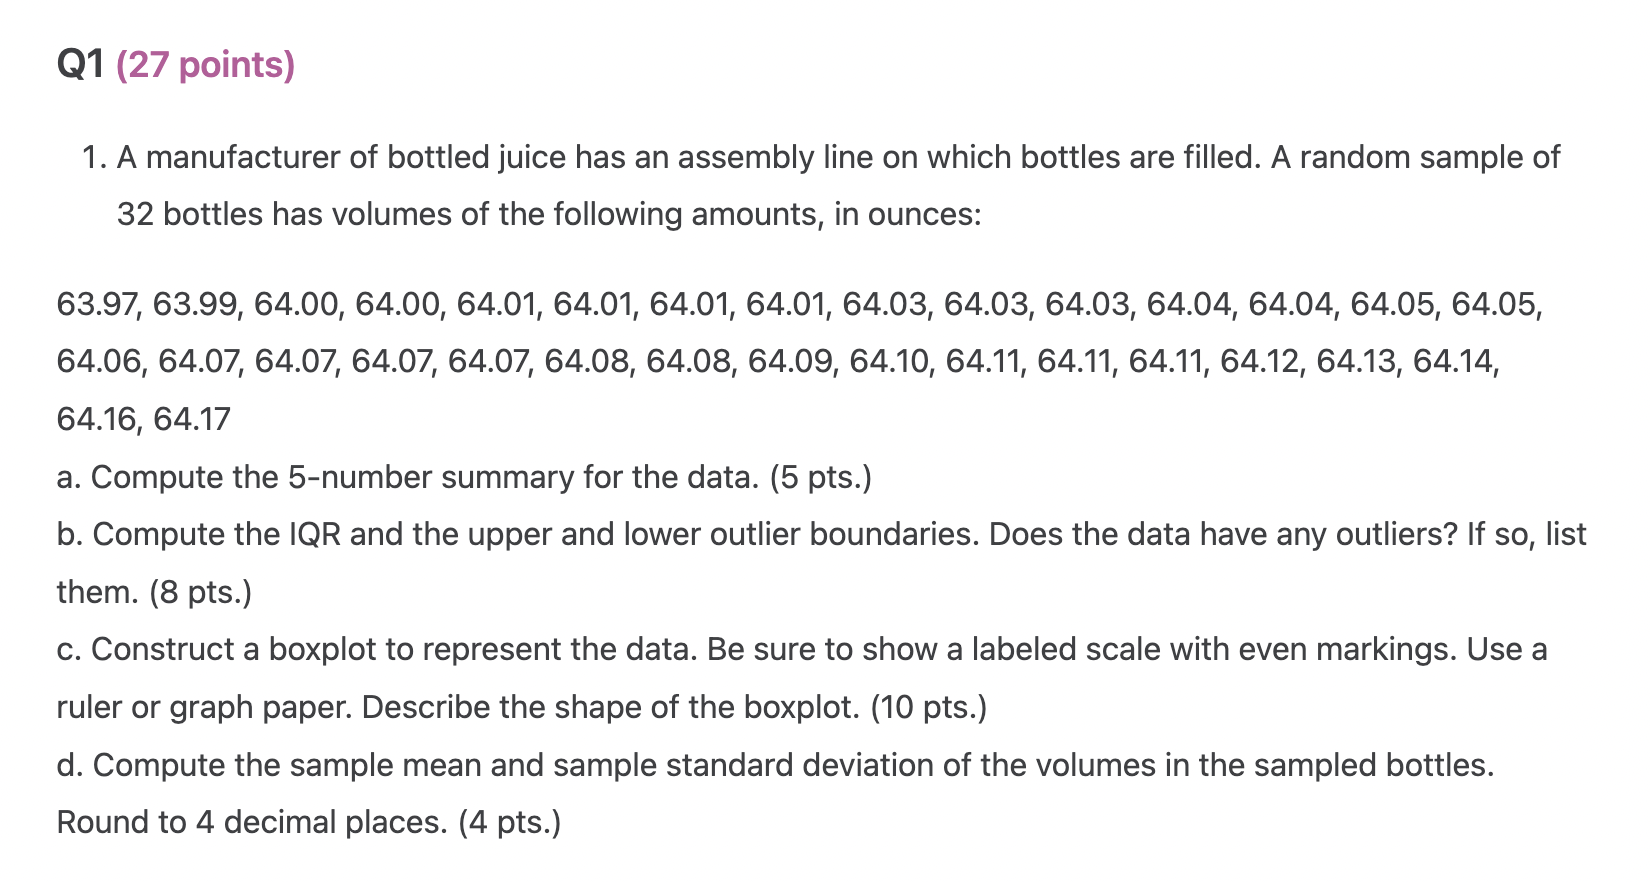
Show all work. No work = no credit. The only exceptions to this are values obtained using 1-Var stats or LinReg(ax+b) or critical values from
Show all work. No work = no credit. The only exceptions to this are values obtained using 1-Var stats or LinReg(ax+b) or critical values from the t-table. If using normalcdf or tcdf, show all inputs. Show formulas where appropriate (outlier boundaries, margins of error, bounds of confidence intervals, test statistic). Round test statistics to 2 decimal places and p-values to 4 decimal places.
1. In question #1, part (f) should refer to the result of part (e), not part (b). In the hypothesis test, use alpha = .05.

Step by Step Solution
There are 3 Steps involved in it
Step: 1

Get Instant Access to Expert-Tailored Solutions
See step-by-step solutions with expert insights and AI powered tools for academic success
Step: 2

Step: 3

Ace Your Homework with AI
Get the answers you need in no time with our AI-driven, step-by-step assistance
Get Started


