Answered step by step
Verified Expert Solution
Question
1 Approved Answer
Show all your work going into the calculations of each ratio and just as important discuss the importance of those numbers and what they tell
Show all your work going into the calculations of each ratio and just as important discuss the importance of those numbers and what they tell you about the companys performance.
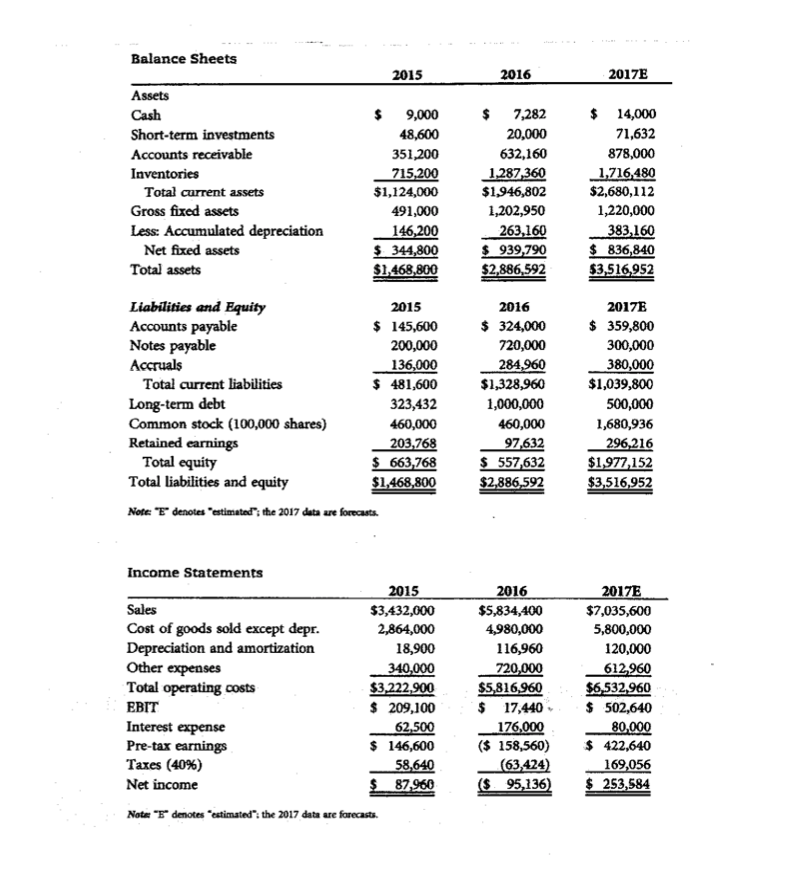
Financial Statement Analysis Ratio Problem. See below for financial statements and calculate and answer the ratios for 2017E (Blank Column Below)
Other Data 2015 $8.50 100,000 $0.880 $0.220 2016 $6.00 100,000 $0.951 $0.110 2017E $12.17 250,000 $1.014 $0.220 Stock price Shares outstanding EPS DPS Tax rate Book value per share Lease payments Noti "E" denotes "estimated: the 2017 data are forecasts. 4096 40% 40% $6.638 $40,000 $5.576 $40,000 $7.909 $40,000 Ratio Analysis Industry Av 2015 2.3 0.8 4.0 37.3 10.0 2.3 35.6% 54.8% 3.3 2.6 2.6% 14.2% 6.0% 13.3% 2016 2017E Current Quick Inventory turnover Days sales outstanding Fixed assets turnover Total assets turnover Debt ratio Liabilities-to-assets ratio TIE EBITDA coverage Profit margin Basic earning power ROA ROE Price/Earnings (P/E) Price/Cash flow Market/Book Note, "E" denotes-estimated." 2.7 0.5 4.0 39.6 6.2 2.0 59.6% 80.7% 0.1 0.8 -1.696 0.6% -3.3% 6.1 32.0 7.0 2.5 32.0% 50.0% 6.2 8.0 3.6% 17.8% 9.0% 17.9% 9.7 -6.3 27.5 1.1 16.2 8.0 7.6 2.9 Other Data 2015 $8.50 100,000 $0.880 $0.220 2016 $6.00 100,000 $0.951 $0.110 2017E $12.17 250,000 $1.014 $0.220 Stock price Shares outstanding EPS DPS Tax rate Book value per share Lease payments Noti "E" denotes "estimated: the 2017 data are forecasts. 4096 40% 40% $6.638 $40,000 $5.576 $40,000 $7.909 $40,000 Ratio Analysis Industry Av 2015 2.3 0.8 4.0 37.3 10.0 2.3 35.6% 54.8% 3.3 2.6 2.6% 14.2% 6.0% 13.3% 2016 2017E Current Quick Inventory turnover Days sales outstanding Fixed assets turnover Total assets turnover Debt ratio Liabilities-to-assets ratio TIE EBITDA coverage Profit margin Basic earning power ROA ROE Price/Earnings (P/E) Price/Cash flow Market/Book Note, "E" denotes-estimated." 2.7 0.5 4.0 39.6 6.2 2.0 59.6% 80.7% 0.1 0.8 -1.696 0.6% -3.3% 6.1 32.0 7.0 2.5 32.0% 50.0% 6.2 8.0 3.6% 17.8% 9.0% 17.9% 9.7 -6.3 27.5 1.1 16.2 8.0 7.6 2.9
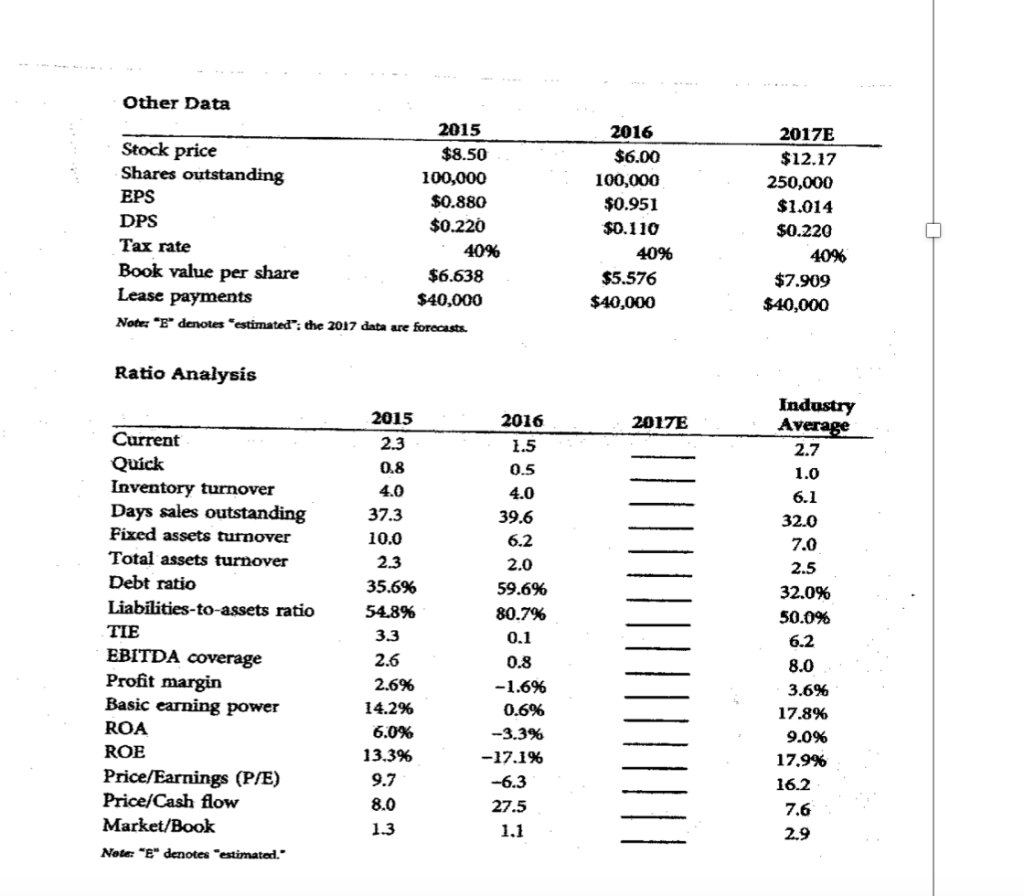
Step by Step Solution
There are 3 Steps involved in it
Step: 1
Get Instant Access to Expert-Tailored Solutions
See step-by-step solutions with expert insights and AI powered tools for academic success
Step: 2
Step: 3
Ace Your Homework with AI
Get the answers you need in no time with our AI-driven, step-by-step assistance
Get Started