Answered step by step
Verified Expert Solution
Question
1 Approved Answer
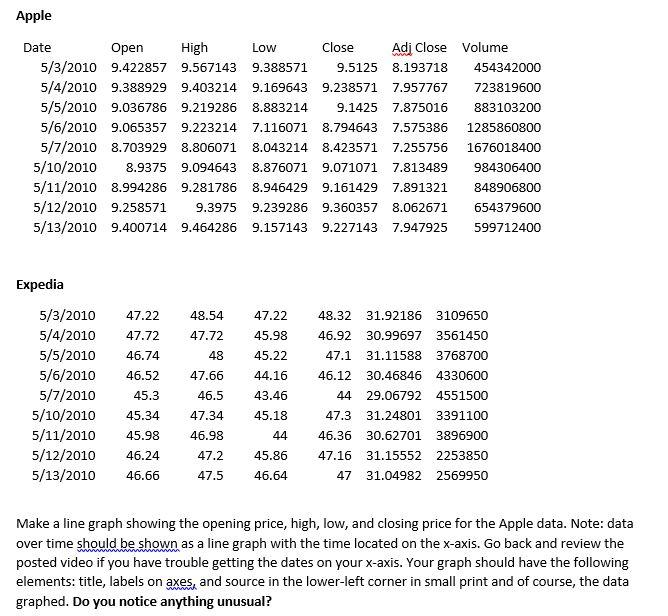
(Show excel formulas in work) Apple Date Open High 5/3/2010 9.422857 9.567143 5/4/2010 9.388929 9.403214 5/5/2010 9.036786 9.219286 5/6/2010 9.065357 9.223214 5/7/2010 8.703929 8.806071 5/10/2010
 (Show excel formulas in work)
Apple Date Open High 5/3/2010 9.422857 9.567143 5/4/2010 9.388929 9.403214 5/5/2010 9.036786 9.219286 5/6/2010 9.065357 9.223214 5/7/2010 8.703929 8.806071 5/10/2010 8.9375 9.094643 5/11/2010 8.994286 9.281786 5/12/2010 9.258571 9.3975 5/13/2010 9.400714 9.464286 Low Close 9.388571 9.5125 9.169643 9.238571 8.883214 9.1425 7.116071 8.794643 8.043214 8.423571 8.876071 9.071071 Volume 454342000 723819600 883103200 Adi Close 8.193718 7.957767 7.875016 7.575386 7.255756 7.813489 7.891321 8.062671 7.947925 1285860800 1676018400 984306400 8.946429 9.161429 848906800 654379600 9.239286 9.157143 9.360357 9.227143 599712400 Expedia 47.22 48.54 47.22 45.98 47.72 47.72 46.74 48 45.22 46.52 44.16 5/3/2010 5/4/2010 5/5/2010 5/6/2010 5/7/2010 5/10/2010 5/11/2010 5/12/2010 5/13/2010 47.66 46.5 45.3 48.32 31.92186 3109650 46.92 30.99697 3561450 47.1 31.11588 3768700 46.12 30.46846 4330600 44 29.06792 4551500 47.3 31.24801 3391100 46.36 30.62701 3896900 47.16 31.15552 2253850 47 31.04982 2569950 45.34 45.98 43.46 45.18 44 47.34 46.98 46.24 47.2 45.86 46.64 46.66 47.5 Make a line graph showing the opening price, high, low, and closing price for the Apple data. Note: data over time should be shown as a line graph with the time located on the x-axis. Go back and review the posted video if you have trouble getting the dates on your x-axis. Your graph should have the following elements: title, labels on axes, and source in the lower-left corner in small print and of course, the data graphed. Do you notice anything unusual? Apple Date Open High 5/3/2010 9.422857 9.567143 5/4/2010 9.388929 9.403214 5/5/2010 9.036786 9.219286 5/6/2010 9.065357 9.223214 5/7/2010 8.703929 8.806071 5/10/2010 8.9375 9.094643 5/11/2010 8.994286 9.281786 5/12/2010 9.258571 9.3975 5/13/2010 9.400714 9.464286 Low Close 9.388571 9.5125 9.169643 9.238571 8.883214 9.1425 7.116071 8.794643 8.043214 8.423571 8.876071 9.071071 Volume 454342000 723819600 883103200 Adi Close 8.193718 7.957767 7.875016 7.575386 7.255756 7.813489 7.891321 8.062671 7.947925 1285860800 1676018400 984306400 8.946429 9.161429 848906800 654379600 9.239286 9.157143 9.360357 9.227143 599712400 Expedia 47.22 48.54 47.22 45.98 47.72 47.72 46.74 48 45.22 46.52 44.16 5/3/2010 5/4/2010 5/5/2010 5/6/2010 5/7/2010 5/10/2010 5/11/2010 5/12/2010 5/13/2010 47.66 46.5 45.3 48.32 31.92186 3109650 46.92 30.99697 3561450 47.1 31.11588 3768700 46.12 30.46846 4330600 44 29.06792 4551500 47.3 31.24801 3391100 46.36 30.62701 3896900 47.16 31.15552 2253850 47 31.04982 2569950 45.34 45.98 43.46 45.18 44 47.34 46.98 46.24 47.2 45.86 46.64 46.66 47.5 Make a line graph showing the opening price, high, low, and closing price for the Apple data. Note: data over time should be shown as a line graph with the time located on the x-axis. Go back and review the posted video if you have trouble getting the dates on your x-axis. Your graph should have the following elements: title, labels on axes, and source in the lower-left corner in small print and of course, the data graphed. Do you notice anything unusual
Step by Step Solution
There are 3 Steps involved in it
Step: 1

Get Instant Access to Expert-Tailored Solutions
See step-by-step solutions with expert insights and AI powered tools for academic success
Step: 2

Step: 3

Ace Your Homework with AI
Get the answers you need in no time with our AI-driven, step-by-step assistance
Get Started


