Answered step by step
Verified Expert Solution
Question
1 Approved Answer
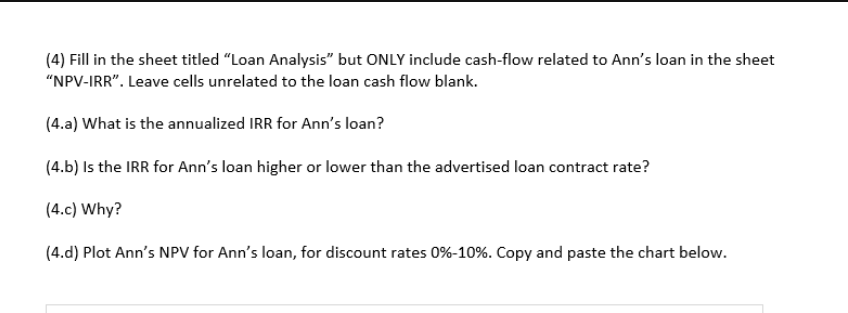
Show Excel Formulas NPV-IRR: Loan Analysis: (4) Fill in the sheet titled Loan Analysis but ONLY include cash-flow related to Ann's loan in the sheet
Show Excel Formulas

NPV-IRR:

Loan Analysis:
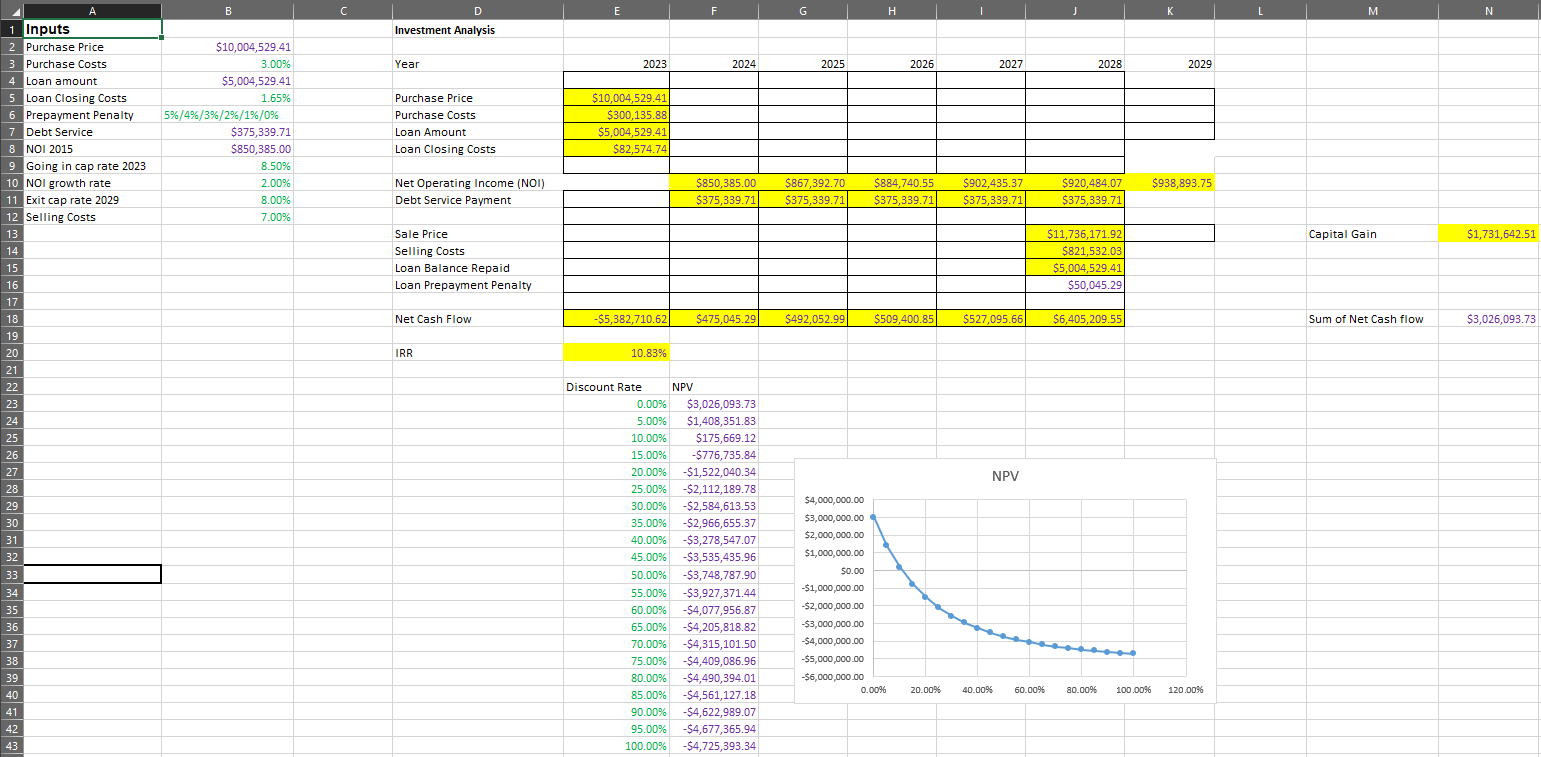
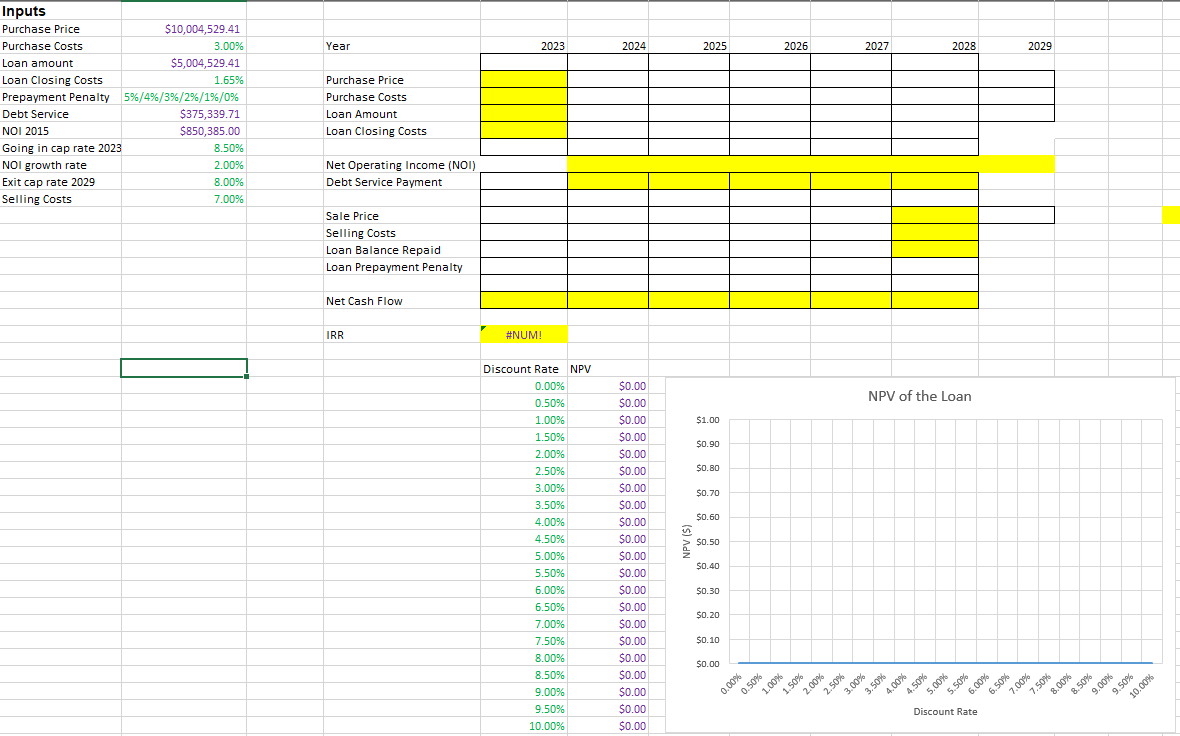
 (4) Fill in the sheet titled "Loan Analysis" but ONLY include cash-flow related to Ann's loan in the sheet "NPV-IRR". Leave cells unrelated to the loan cash flow blank. (4.a) What is the annualized IRR for Ann's loan? (4.b) Is the IRR for Ann's loan higher or lower than the advertised loan contract rate? (4.c) Why? (4.d) Plot Ann's NPV for Ann's loan, for discount rates 0\%-10\%. Copy and paste the chart below. 1 In 2 P 4 5 6 7 8 9 10 11 12 13 14 15 16 17 18 19 20 21 22 23 2524 2625 27 28 29 30 31 32 33 \begin{tabular}{l} 34 \\ \hline 35 \\ \hline \end{tabular} 35 36 37 38 39 40 41 42 43 Investment Analysis Purchase Price $10,004,529.41 3.00% Year Loan Closing Costs $5,004,529.41 1.65% 5%/4%/3%/2%/1%/0% Purchase Price Purchase Costs Loan Amount Loan Closing Costs $375,339.71 $850,385.00 8.50% Net Operating Income (NOI) 2.00% Debt Service Payment Sale Price 7.00% Selling Costs Loan Balance Repaid Loan Prepayment Penalty Net Cash Flow $5,382,710.62 $475,045.29 $492,052.99 $509,400.85 $527,095.66 $6,405,209.55 10.83% Sum of Net Cash flow $3,026,093.73 IRR \begin{tabular}{|r|r|} \hline Rate & NPV \\ \hline 0.00% & $3,026,093.73 \\ \hline 5.00% & $1,408,351.83 \\ \hline 10.00% & $175,669.12 \\ \hline 15.00% & $776,735.84 \\ \hline 20.00% & $1,522,040.34 \\ \hline 25.00% & $2,112,189.78 \\ \hline 30.00% & $2,584,613.53 \\ \hline 35.00% & $2,966,655.37 \\ \hline 40.00% & $3,278,547.07 \\ \hline 45.00% & $3,535,435.96 \\ \hline 50.00% & $3,748,787.90 \\ \hline 55.00% & $3,927,371.44 \\ \hline 60.00% & $4,077,956.87 \\ \hline 65.00% & $4,205,818.82 \\ \hline 70.00% & $4,315,101.50 \\ \hline 75.00% & $4,409,086.96 \\ \hline 80.00% & $4,490,394.01 \\ \hline 85.00% & $4,561,127.18 \\ \hline 90.00% & $4,622,989.07 \\ \hline 95.00% & $4,677,365.94 \\ \hline 100.00% & $4,725,393.34 \\ \hline \end{tabular} Capital Gain $1,731,642,51 \begin{tabular}{|c|c|c|c|c|c|c|} \hline 2023 & 2024 & 2025 & 2026 & 2027 & 2028 & 2029 \\ \hline$300,135.88 & & & & & & \\ \hline$5,004,529.41 & & & & & & \\ \hline$82,574.74 & & & & & & \\ \hline \end{tabular} \begin{tabular}{|r|r|r|r|r|r|} \hline & $375,339.71 & $375,339.71 & $375,339.71 & $375,339.71 & $375,339.71 \\ \hline & & & & & \\ \hline & & & & & $11,736,171.92 \\ \hline \end{tabular} \begin{tabular}{|c|c|c|c|c|c|} \hline & & & & & $5,004,529.41 \\ \hline & & & & & $50,045.29 \\ \hline$5,382,710.62 & $475,045.29 & $492,052.99 & $509,400.85 & $527,095.66 & $6,405,209.55 \\ \hline \end{tabular} (4) Fill in the sheet titled "Loan Analysis" but ONLY include cash-flow related to Ann's loan in the sheet "NPV-IRR". Leave cells unrelated to the loan cash flow blank. (4.a) What is the annualized IRR for Ann's loan? (4.b) Is the IRR for Ann's loan higher or lower than the advertised loan contract rate? (4.c) Why? (4.d) Plot Ann's NPV for Ann's loan, for discount rates 0\%-10\%. Copy and paste the chart below. 1 In 2 P 4 5 6 7 8 9 10 11 12 13 14 15 16 17 18 19 20 21 22 23 2524 2625 27 28 29 30 31 32 33 \begin{tabular}{l} 34 \\ \hline 35 \\ \hline \end{tabular} 35 36 37 38 39 40 41 42 43 Investment Analysis Purchase Price $10,004,529.41 3.00% Year Loan Closing Costs $5,004,529.41 1.65% 5%/4%/3%/2%/1%/0% Purchase Price Purchase Costs Loan Amount Loan Closing Costs $375,339.71 $850,385.00 8.50% Net Operating Income (NOI) 2.00% Debt Service Payment Sale Price 7.00% Selling Costs Loan Balance Repaid Loan Prepayment Penalty Net Cash Flow $5,382,710.62 $475,045.29 $492,052.99 $509,400.85 $527,095.66 $6,405,209.55 10.83% Sum of Net Cash flow $3,026,093.73 IRR \begin{tabular}{|r|r|} \hline Rate & NPV \\ \hline 0.00% & $3,026,093.73 \\ \hline 5.00% & $1,408,351.83 \\ \hline 10.00% & $175,669.12 \\ \hline 15.00% & $776,735.84 \\ \hline 20.00% & $1,522,040.34 \\ \hline 25.00% & $2,112,189.78 \\ \hline 30.00% & $2,584,613.53 \\ \hline 35.00% & $2,966,655.37 \\ \hline 40.00% & $3,278,547.07 \\ \hline 45.00% & $3,535,435.96 \\ \hline 50.00% & $3,748,787.90 \\ \hline 55.00% & $3,927,371.44 \\ \hline 60.00% & $4,077,956.87 \\ \hline 65.00% & $4,205,818.82 \\ \hline 70.00% & $4,315,101.50 \\ \hline 75.00% & $4,409,086.96 \\ \hline 80.00% & $4,490,394.01 \\ \hline 85.00% & $4,561,127.18 \\ \hline 90.00% & $4,622,989.07 \\ \hline 95.00% & $4,677,365.94 \\ \hline 100.00% & $4,725,393.34 \\ \hline \end{tabular} Capital Gain $1,731,642,51 \begin{tabular}{|c|c|c|c|c|c|c|} \hline 2023 & 2024 & 2025 & 2026 & 2027 & 2028 & 2029 \\ \hline$300,135.88 & & & & & & \\ \hline$5,004,529.41 & & & & & & \\ \hline$82,574.74 & & & & & & \\ \hline \end{tabular} \begin{tabular}{|r|r|r|r|r|r|} \hline & $375,339.71 & $375,339.71 & $375,339.71 & $375,339.71 & $375,339.71 \\ \hline & & & & & \\ \hline & & & & & $11,736,171.92 \\ \hline \end{tabular} \begin{tabular}{|c|c|c|c|c|c|} \hline & & & & & $5,004,529.41 \\ \hline & & & & & $50,045.29 \\ \hline$5,382,710.62 & $475,045.29 & $492,052.99 & $509,400.85 & $527,095.66 & $6,405,209.55 \\ \hline \end{tabular}
 Step by Step Solution
There are 3 Steps involved in it
Step: 1

Get Instant Access to Expert-Tailored Solutions
See step-by-step solutions with expert insights and AI powered tools for academic success
Step: 2

Step: 3

Ace Your Homework with AI
Get the answers you need in no time with our AI-driven, step-by-step assistance
Get Started


