Answered step by step
Verified Expert Solution
Question
1 Approved Answer
show formula and work in excel (Problem 2.15) A financial management company offers a tax-sheltered annuity called a fixed account. The following is a model
show formula and work in excel 
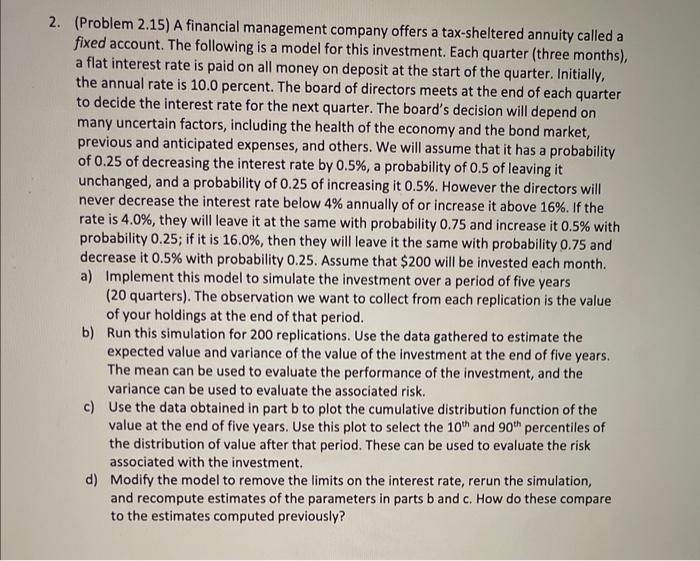
(Problem 2.15) A financial management company offers a tax-sheltered annuity called a fixed account. The following is a model for this investment. Each quarter (three months), a flat interest rate is paid on all money on deposit at the start of the quarter. Initially, the annual rate is 10.0 percent. The board of directors meets at the end of each quarter to decide the interest rate for the next quarter. The board's decision will depend on many uncertain factors, including the health of the economy and the bond market, previous and anticipated expenses, and others. We will assume that it has a probability of 0.25 of decreasing the interest rate by 0.5%, a probability of 0.5 of leaving it unchanged, and a probability of 0.25 of increasing it 0.5%. However the directors will never decrease the interest rate below 4% annually of or increase it above 16%. If the rate is 4.0%, they will leave it at the same with probability 0.75 and increase it 0.5% with probability 0.25; if it is 16.0%, then they will leave it the same with probability 0.75 and decrease it 0.5% with probability 0.25. Assume that $200 will be invested each month. a) Implement this model to simulate the investment over a period of five years (20 quarters). The observation we want to collect from each replication is the value of your holdings at the end of that period. b) Run this simulation for 200 replications. Use the data gathered to estimate the expected value and variance of the value of the investment at the end of five years. The mean can be used to evaluate the performance of the investment, and the variance can be used to evaluate the associated risk. c) Use the data obtained in part b to plot the cumulative distribution function of the value at the end of five years. Use this plot to select the 10th and 90th percentiles of the distribution of value after that period. These can be used to evaluate the risk associated with the investment. d) Modify the model to remove the limits on the interest rate, rerun the simulation, and recompute estimates of the parameters in parts b and c. How do these compare to the estimates computed previously? (Problem 2.15) A financial management company offers a tax-sheltered annuity called a fixed account. The following is a model for this investment. Each quarter (three months), a flat interest rate is paid on all money on deposit at the start of the quarter. Initially, the annual rate is 10.0 percent. The board of directors meets at the end of each quarter to decide the interest rate for the next quarter. The board's decision will depend on many uncertain factors, including the health of the economy and the bond market, previous and anticipated expenses, and others. We will assume that it has a probability of 0.25 of decreasing the interest rate by 0.5%, a probability of 0.5 of leaving it unchanged, and a probability of 0.25 of increasing it 0.5%. However the directors will never decrease the interest rate below 4% annually of or increase it above 16%. If the rate is 4.0%, they will leave it at the same with probability 0.75 and increase it 0.5% with probability 0.25; if it is 16.0%, then they will leave it the same with probability 0.75 and decrease it 0.5% with probability 0.25. Assume that $200 will be invested each month. a) Implement this model to simulate the investment over a period of five years (20 quarters). The observation we want to collect from each replication is the value of your holdings at the end of that period. b) Run this simulation for 200 replications. Use the data gathered to estimate the expected value and variance of the value of the investment at the end of five years. The mean can be used to evaluate the performance of the investment, and the variance can be used to evaluate the associated risk. c) Use the data obtained in part b to plot the cumulative distribution function of the value at the end of five years. Use this plot to select the 10th and 90th percentiles of the distribution of value after that period. These can be used to evaluate the risk associated with the investment. d) Modify the model to remove the limits on the interest rate, rerun the simulation, and recompute estimates of the parameters in parts b and c. How do these compare to the estimates computed previously 
Step by Step Solution
There are 3 Steps involved in it
Step: 1

Get Instant Access to Expert-Tailored Solutions
See step-by-step solutions with expert insights and AI powered tools for academic success
Step: 2

Step: 3

Ace Your Homework with AI
Get the answers you need in no time with our AI-driven, step-by-step assistance
Get Started


