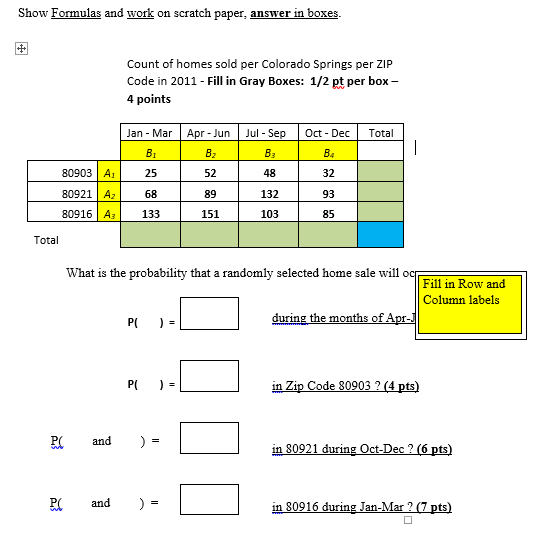
Show Formulas and work on scratch paper, answer in boxes. Count of homes sold per Colorado Springs per ZIP Code in 2011 - Fill in Gray Boxes: 1/2 pt per box - 4 points Jan - Mar Apr - Jun Jul - Sep Oct - Dec Total BE 30903 25 52 48 32 30921 68 Bg 132 80916 AE 133 151 103 85 Total What is the probability that a randomly selected home sale will ocr Fill in Row and Column labels P( ) = during the months of Apr-J P( ) = in Zip Code 80903 ? (4 pts) PC and ) = in 80921 during Oct-Dec ? (6 pts) PC and ) = in 80916 during Jan-Mar ? (7 pts)5-1.A rug manufacturer has decided to use seven compatible colors in her rugs. However, in weaving a rug, only five spindles can be used. In advertising, the rug manufacturer wants to indicate the number of different color groupings for sale. How many color groupings using the seven colors taken five at a time are there? (This assumes that five different colors will go into each rug-in other words, there are no repetitions of color.) 5-2.The Grand 16 movie theater uses teams of three employees to work the concession stand each evening. There are seven employees available to work. How many different teams can be scheduled? 5-3.In a lottery game, three numbers are randomly selected from a tumbler of balls labeled 1-50. How many combinations are possible. 5-4, Solve the following: 5-5.Solve the following:Question 1. Anewer on the corresponding line. Show Probability Statement, Formulas and Work on the corresponding CURVE section: (ON THE FOLLOWING PAGES). Annotate the normal curve for each. (Normal Curve Table on last page of this exam Note: Each question below has a corresponding Normal Curve and Workspace on the following pages. L = $207.250 1 = $44 191 82 What is the percent probability that a randomly selected year will have home sales that are: A. Greater than 250,000% B. Less than $210,0003 C. Between $190,000 and $220,000% D. Between $260,000 and $325,000%.Question 2. Answer on the corresponding line. Show Probability Statement, Formulas and Work on the corresponding curve section: (ON NEXT PAGES), Annotate the normal curve for each. (Normal Curve Table on last page of this exam) In 2018, The U.S Department of Agriculture issues a report indicating a family of four spent on average of $1054.30 per month on food. Assume the distribution of food expenditures for a family of four follows the normal distribution with a standard deviation of $120 per month. $1054.50 $120 A. What percentage of the families spend more than $900 but less than $1054.50 per month on food. B. What percent spend less than $900 per month on food? C. What percent spend between $900 and $1200 per month on food? D. What percent spend between $900 and$1000 per month on food?Prob. 14 Prob. 1B Prob. 1C Prob. 1DProb. 2A Prob. 2B Prob. 2C Prob. 2D\f