 show full step pls
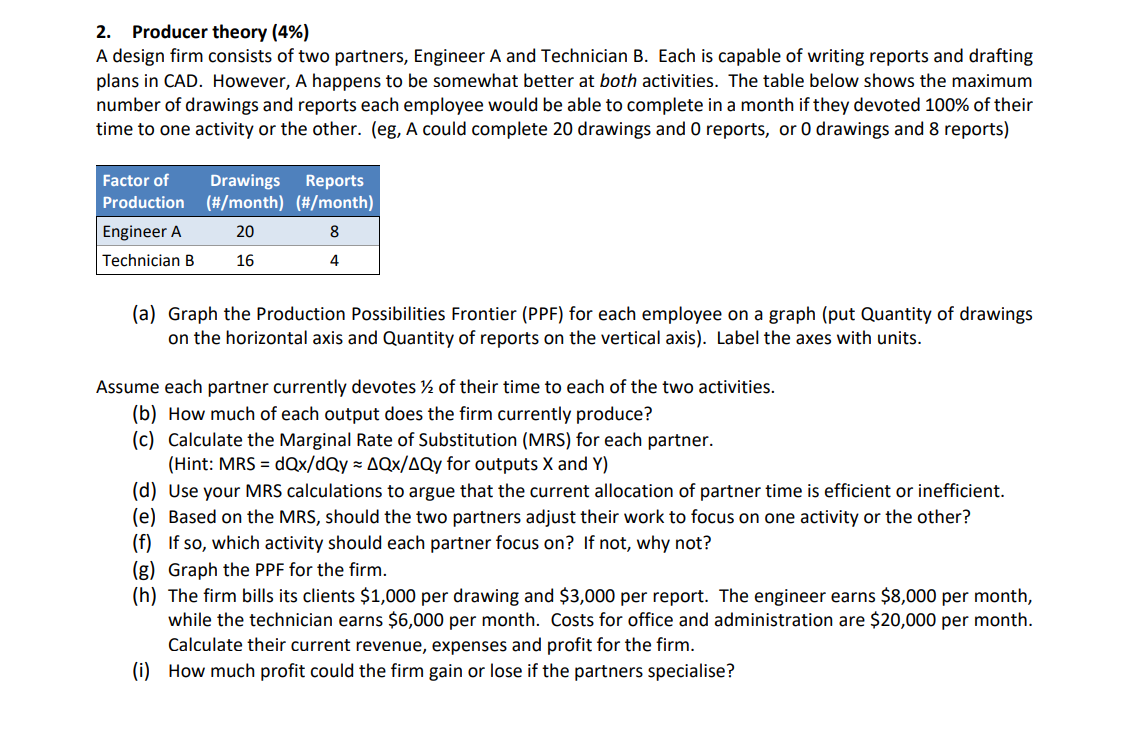
2. Producer theory (4%) A design firm consists of two partners, Engineer A and Technician B. Each is capable of writing reports and drafting plans in CAD. However, A happens to be somewhat better at both activities. The table below shows the maximum number of drawings and reports each employee would be able to complete in a month if they devoted 100% of their time to one activity or the other. (eg, A could complete 20 drawings and 0 reports, or 0 drawings and 8 reports) (a) Graph the Production Possibilities Frontier (PPF) for each employee on a graph (put Quantity of drawings on the horizontal axis and Quantity of reports on the vertical axis). Label the axes with units. Assume each partner currently devotes 1/2 of their time to each of the two activities. (b) How much of each output does the firm currently produce? (c) Calculate the Marginal Rate of Substitution (MRS) for each partner. (Hint: MRS=dQx/dQyQx/Qy for outputs X and Y ) (d) Use your MRS calculations to argue that the current allocation of partner time is efficient or inefficient. (e) Based on the MRS, should the two partners adjust their work to focus on one activity or the other? (f) If so, which activity should each partner focus on? If not, why not? (g) Graph the PPF for the firm. (h) The firm bills its clients $1,000 per drawing and $3,000 per report. The engineer earns $8,000 per month, while the technician earns $6,000 per month. Costs for office and administration are $20,000 per month. Calculate their current revenue, expenses and profit for the firm. (i) How much profit could the firm gain or lose if the partners specialise? 2. Producer theory (4%) A design firm consists of two partners, Engineer A and Technician B. Each is capable of writing reports and drafting plans in CAD. However, A happens to be somewhat better at both activities. The table below shows the maximum number of drawings and reports each employee would be able to complete in a month if they devoted 100% of their time to one activity or the other. (eg, A could complete 20 drawings and 0 reports, or 0 drawings and 8 reports) (a) Graph the Production Possibilities Frontier (PPF) for each employee on a graph (put Quantity of drawings on the horizontal axis and Quantity of reports on the vertical axis). Label the axes with units. Assume each partner currently devotes 1/2 of their time to each of the two activities. (b) How much of each output does the firm currently produce? (c) Calculate the Marginal Rate of Substitution (MRS) for each partner. (Hint: MRS=dQx/dQyQx/Qy for outputs X and Y ) (d) Use your MRS calculations to argue that the current allocation of partner time is efficient or inefficient. (e) Based on the MRS, should the two partners adjust their work to focus on one activity or the other? (f) If so, which activity should each partner focus on? If not, why not? (g) Graph the PPF for the firm. (h) The firm bills its clients $1,000 per drawing and $3,000 per report. The engineer earns $8,000 per month, while the technician earns $6,000 per month. Costs for office and administration are $20,000 per month. Calculate their current revenue, expenses and profit for the firm. (i) How much profit could the firm gain or lose if the partners specialise