show full work please
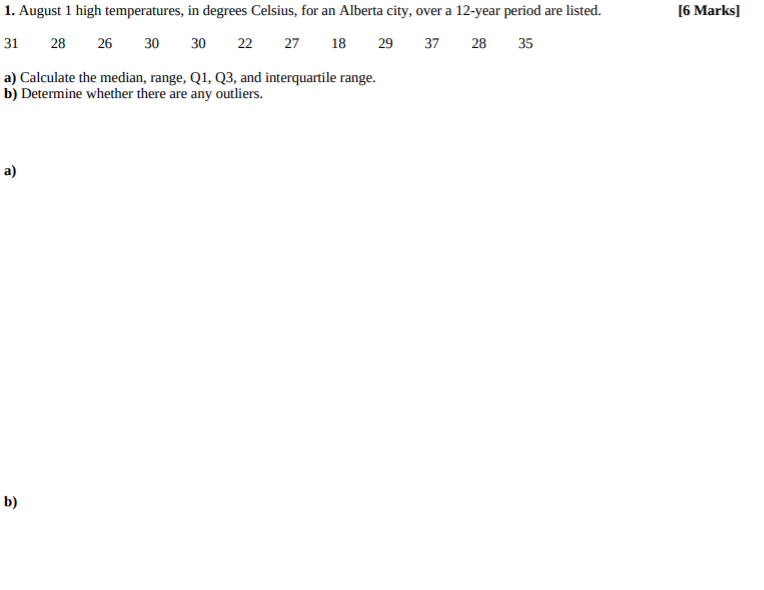
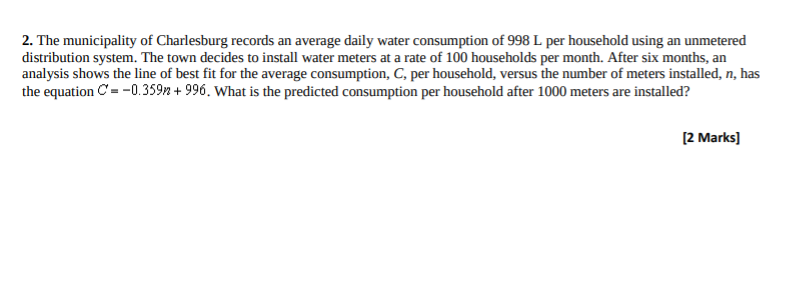
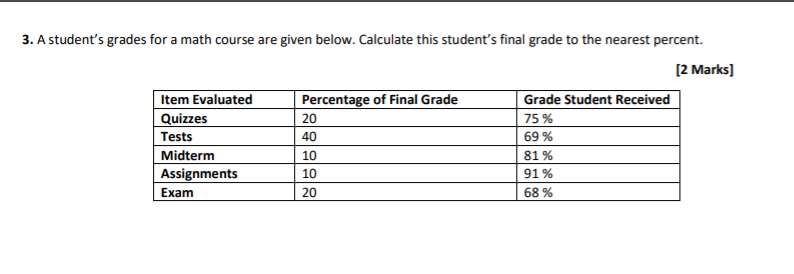
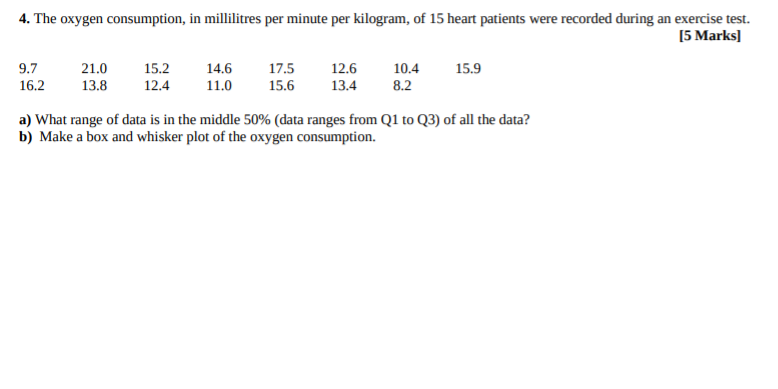
1. August 1 high temperatures, in degrees Celsius, for an Alberta city, over a 12-year period are listed. [6 Marks] 31 28 26 30 30 22 27 18 29 37 28 35 a) Calculate the median, range, Q1, Q3, and interquartile range. b) Determine whether there are any outliers. a) b)2. The municipality of Charlesburg records an average daily water consumption of 998 L per household using an unmetered distribution system. The town decides to install water meters at a rate of 100 households per month. After six months, an analysis shows the line of best fit for the average consumption, C, per household, versus the number of meters installed, n, has the equation @= -0.359% + 996. What is the predicted consumption per household after 1000 meters are installed? [2 Marks]3. A student's grades for a math course are given below. Calculate this student's final grade to the nearest percent. [2 Marks] Item Evaluated Percentage of Final Grade Grade Student Received Quizzes 20 75 % Tests 40 69 % Midterm 10 81 % Assignments 10 91 % Exam 20 68%4. The oxygen consumption, in millilitres per minute per kilogram, of 15 heart patients were recorded during an exercise test. [5 Marks] 9.7 21.0 15.2 14.6 17.5 12.6 10.4 15.9 16.2 13.8 12.4 11.0 15.6 13.4 8.2 a) What range of data is in the middle 50% (data ranges from Q1 to Q3) of all the data? b) Make a box and whisker plot of the oxygen consumption.5. A particular brand of lightbulbs has a mean lifetime of 58.4 months, with a standard deviation of 5.2 months. A sample of 12 lightbulbs was taken and their lifetimes, in months, are recorded. 56.3 59.2 61.8 43.1 68.8 51.2 58.5 56.4 64.2 66.9 49.0 60.1 a) Calculate the mean, variance, and standard deviation. b) Compare the average lifetime and spread of the sample to those of the population. c) What are the z-scores of the extreme upper and lower lifetimes? [5 Marks] a) b) c)6. The table summarizes the final marks in a Data Management class. Identify the outlier. Give a reason why the outlier should be removed before calculating the mean mark. Final Mark [1 Mark] 73 73 64 67 73 67 90 71 75 72 60 71 66 75 237. During early explorations in Africa, explorers who camped near certain trees often came down with malaria. The trees were named fever trees and were usually found on the edges of swampy areas. A graph shows the relationship between the percent of explorers who developed malaria and the number of nights spent near fever trees. Predict the number of nights that would result in 100% of the explorers developing malaria. To test their prediction, the explorers camped in a dry area, far from fever trees, and noticed that the incidence of new malaria cases dropped off. Can this be taken as evidence that the fever trees caused the malaria? [2 Marks] Collection 1 Scatter Plot # 30- 25 20- Malaria Percent 15 10 2 6 8 10 12 Nights - Malaria_Percent = 1.99Nights + 2.9; 2 = 0.948. Each statement is false. Explain why. a) The variance and standard deviation are used to determine the central tendency of a data set. b) The standard deviation is expressed without units. c) Quartiles and percentiles are different measures because they are calculated differently. d) For grouped data, the measures of spread are just as accurate as with raw data. e) A percentile is the specific data point converted to a percent. f) The interquartile range includes the upper 25% and lower 25% of the data. g) A z-score indicates how far the standard deviation lies from the mean. a) b) c) d) e) f) g)