

Answered step by step
Verified Expert Solution
Question
1 Approved Answer
Show how to do in excel, please 2. Put(35) = $1.53, Put(40) = $3.26, Put(45) = $5.75. Using MS Excel, create profit tables and graphs
Show how to do in excel, please 

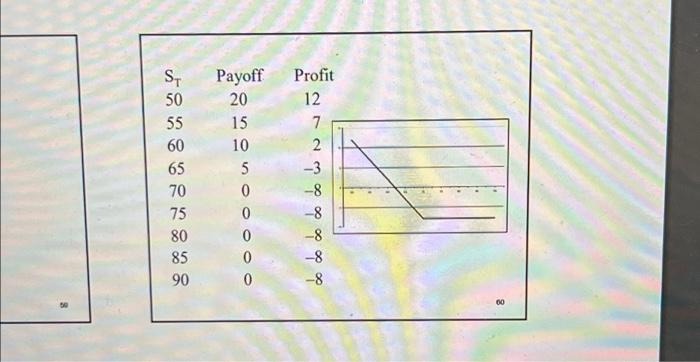
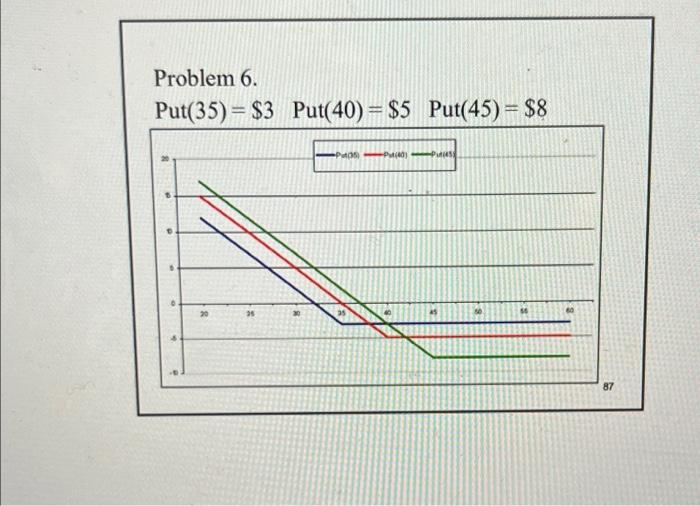
2. Put(35) = $1.53, Put(40) = $3.26, Put(45) = $5.75. Using MS Excel, create profit tables and graphs separately for each long put and then create a single chart showing profit for each long put on the same graph, clearly label each profit curve. For the second part of the assignment, the ultimate task is to create graphs separately for each long put similar to the one shown on slide #60 in the second part of Topic 6, and then create a single chart showing profit for each long put on the same graph similar to the one shown on slide #87 in the second part of Topic 6. Payoff do do do do do wnu 12 Profit Problem 6. Put(35) = $3 Put(40) = $5 Put(45) = $8 $ PSPP 20 35 87 Step by Step Solution
There are 3 Steps involved in it
Step: 1

Get Instant Access to Expert-Tailored Solutions
See step-by-step solutions with expert insights and AI powered tools for academic success
Step: 2

Step: 3
Ace Your Homework with AI
Get the answers you need in no time with our AI-driven, step-by-step assistance
Get Started
Enron And World Finance A Case Study In Ethics
Authors: P. Dembinski, C. Lager, A. Cornford, J. Bonvin
1st Edition
1403947635, 978-1403947635