Answered step by step
Verified Expert Solution
Link Copied!

Question

1 Approved Answer

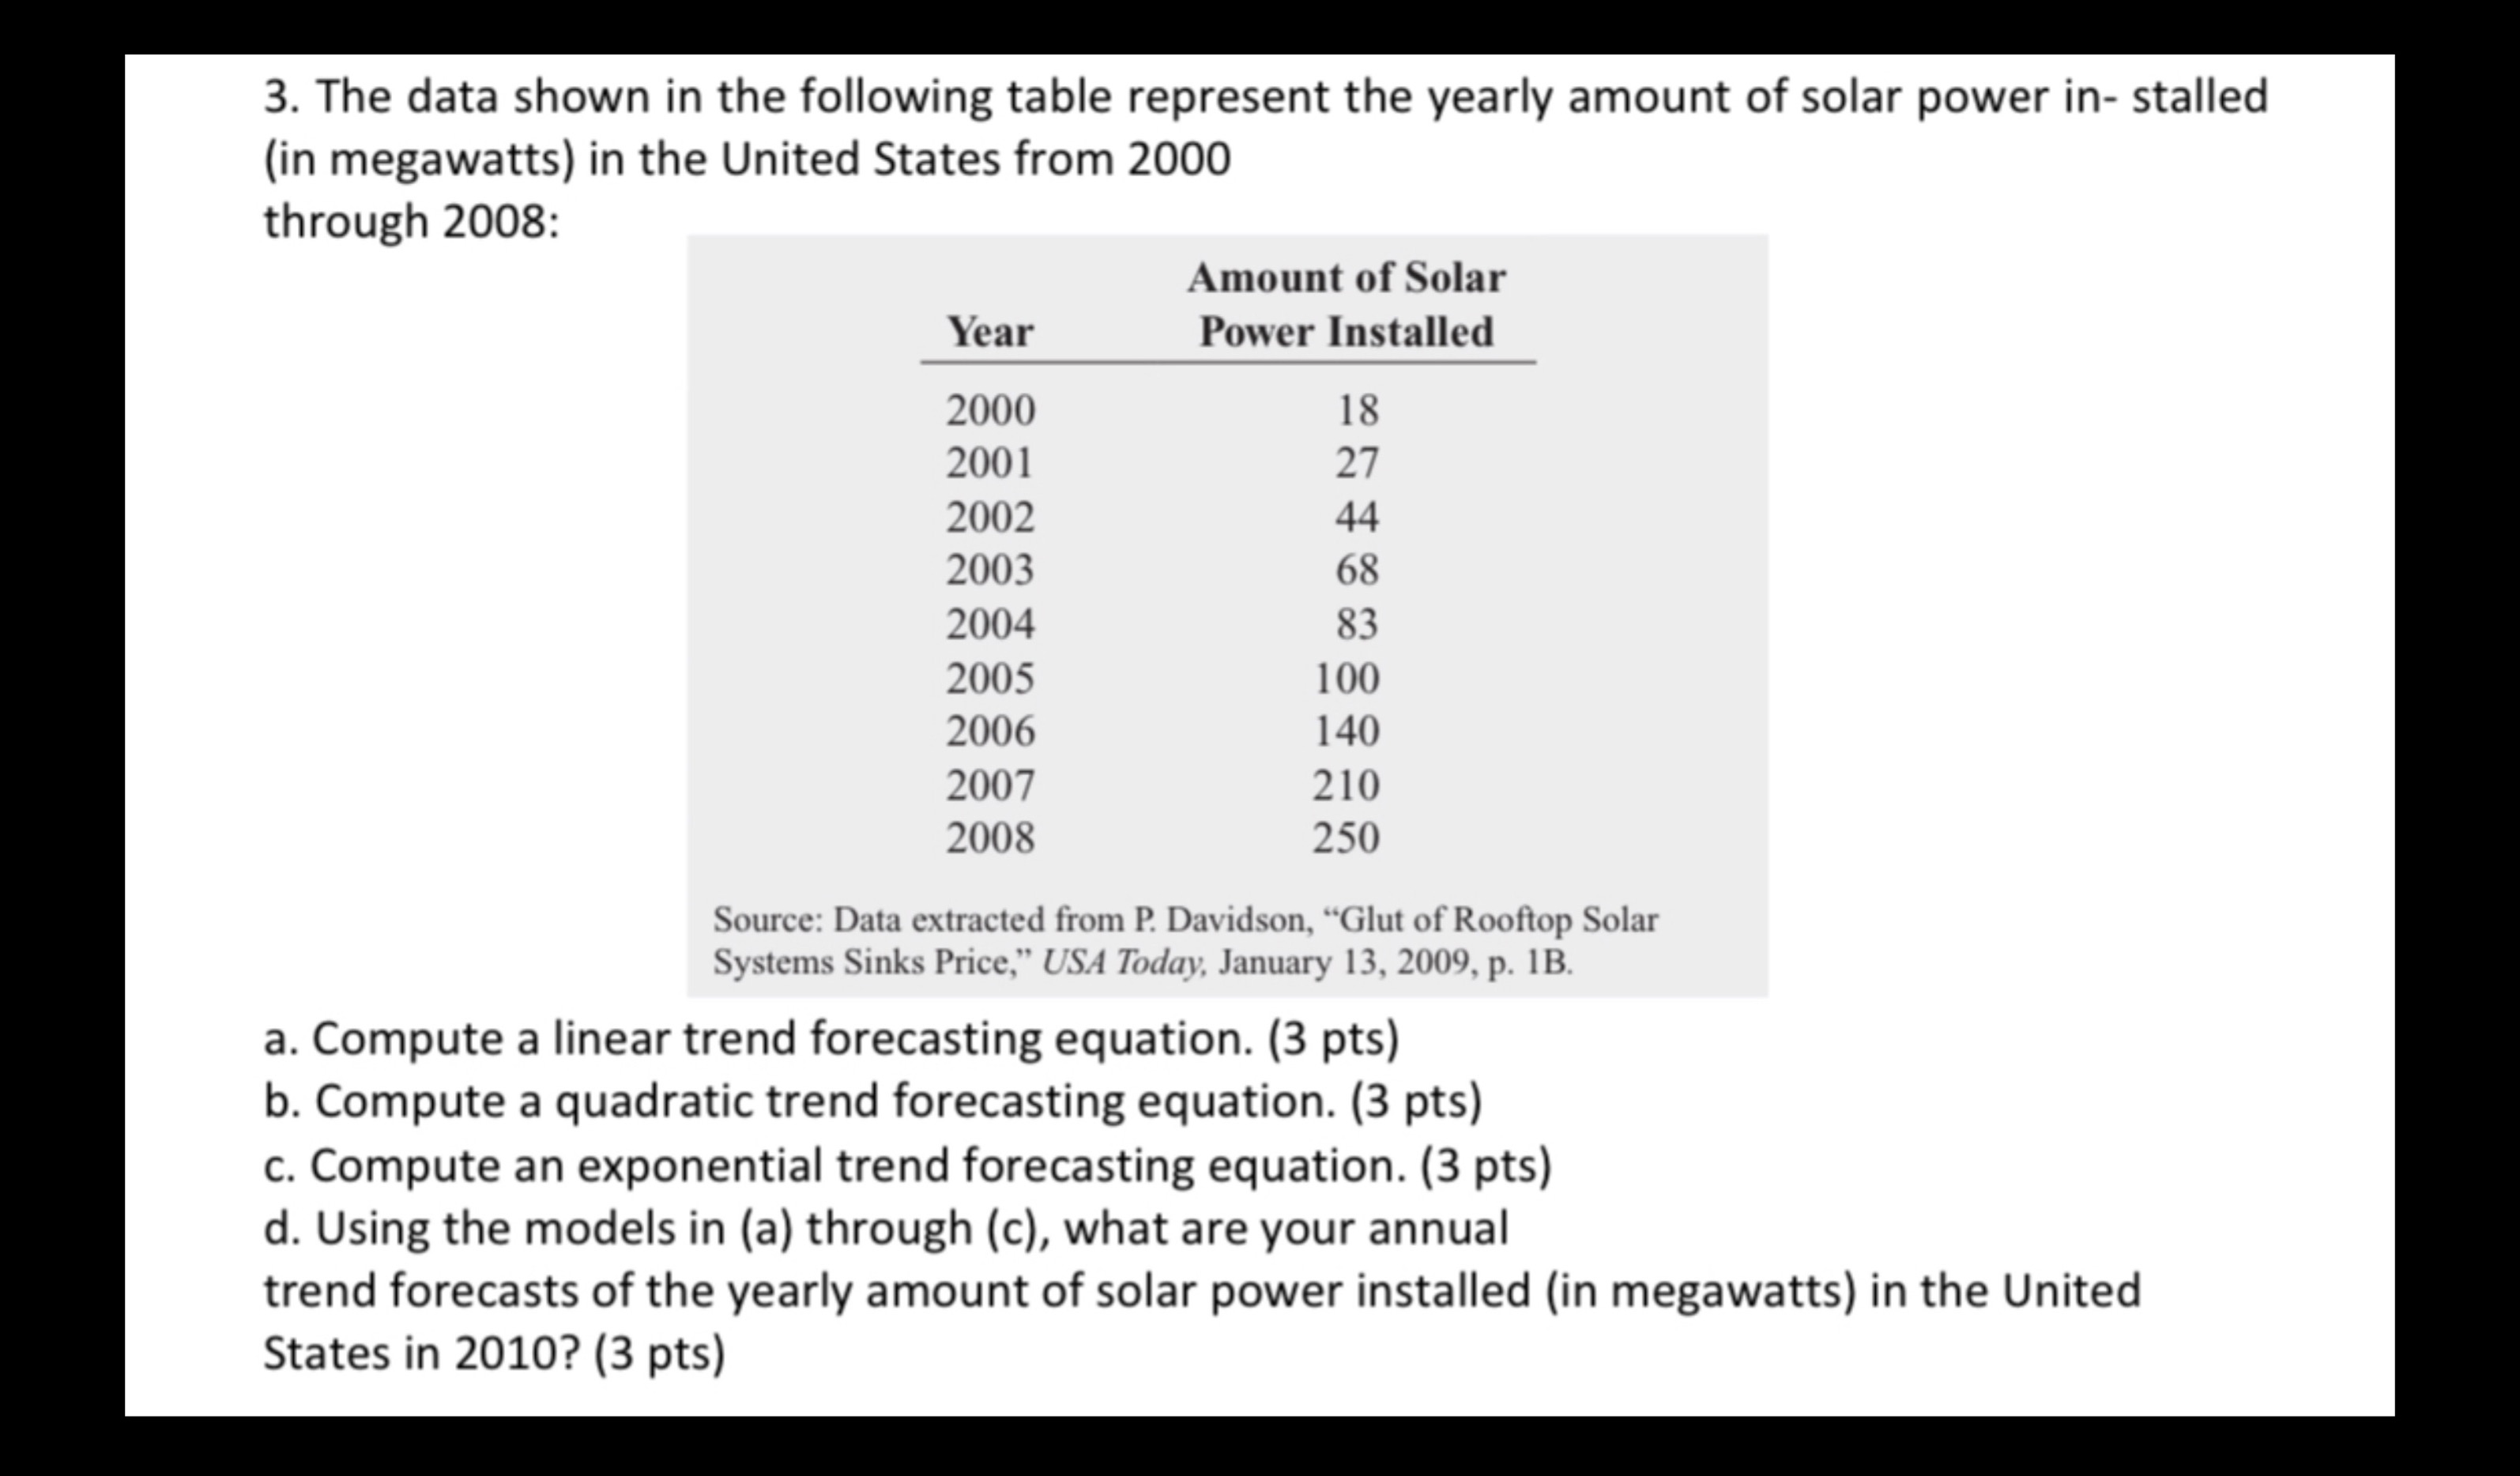
Show solution 3. The data shown in the following table represent the yearly amount of solar power in- stalled (in megawatts) in the United States

Show solution

image text in transcribed
3. The data shown in the following table represent the yearly amount of solar power in- stalled (in megawatts) in the United States from 2000 through 2008: Amount of Solar Year Power Installed 2000 18 2001 27 2002 44 2003 68 2004 83 2005 100 2006 140 2007 210 2008 250 Source: Data extracted from P. Davidson, \"Glut of Rooftop Solar Systems Sinks Price." USA Todqv. January IS. 2009. p. 18. 3. Compute a linear trend forecasting equation. (3 pts) b. Compute a quadratic trend forecasting equation. (3 pts) c. Compute an exponential trend forecasting equation. (3 pts) d. Using the models in (a) through (c), what are your annual trend forecasts of the yearly amount of solar power installed (in megawatts) in the United States in 2010? (3 pts)

Step by Step Solution

There are 3 Steps involved in it

Step: 1

blur-text-image

Get Instant Access to Expert-Tailored Solutions

See step-by-step solutions with expert insights and AI powered tools for academic success

Step: 2

blur-text-image

Step: 3

blur-text-image

Ace Your Homework with AI

Get the answers you need in no time with our AI-driven, step-by-step assistance

Get Started

Recommended Textbook for

Geometry And Analysis Of Fractals Hong Kong, December 2012

Authors: De Jun Feng, Ka Sing Lau

1st Edition

3662439204, 9783662439203

More Books

Students also viewed these Mathematics questions