

Answered step by step
Verified Expert Solution
Question
1 Approved Answer
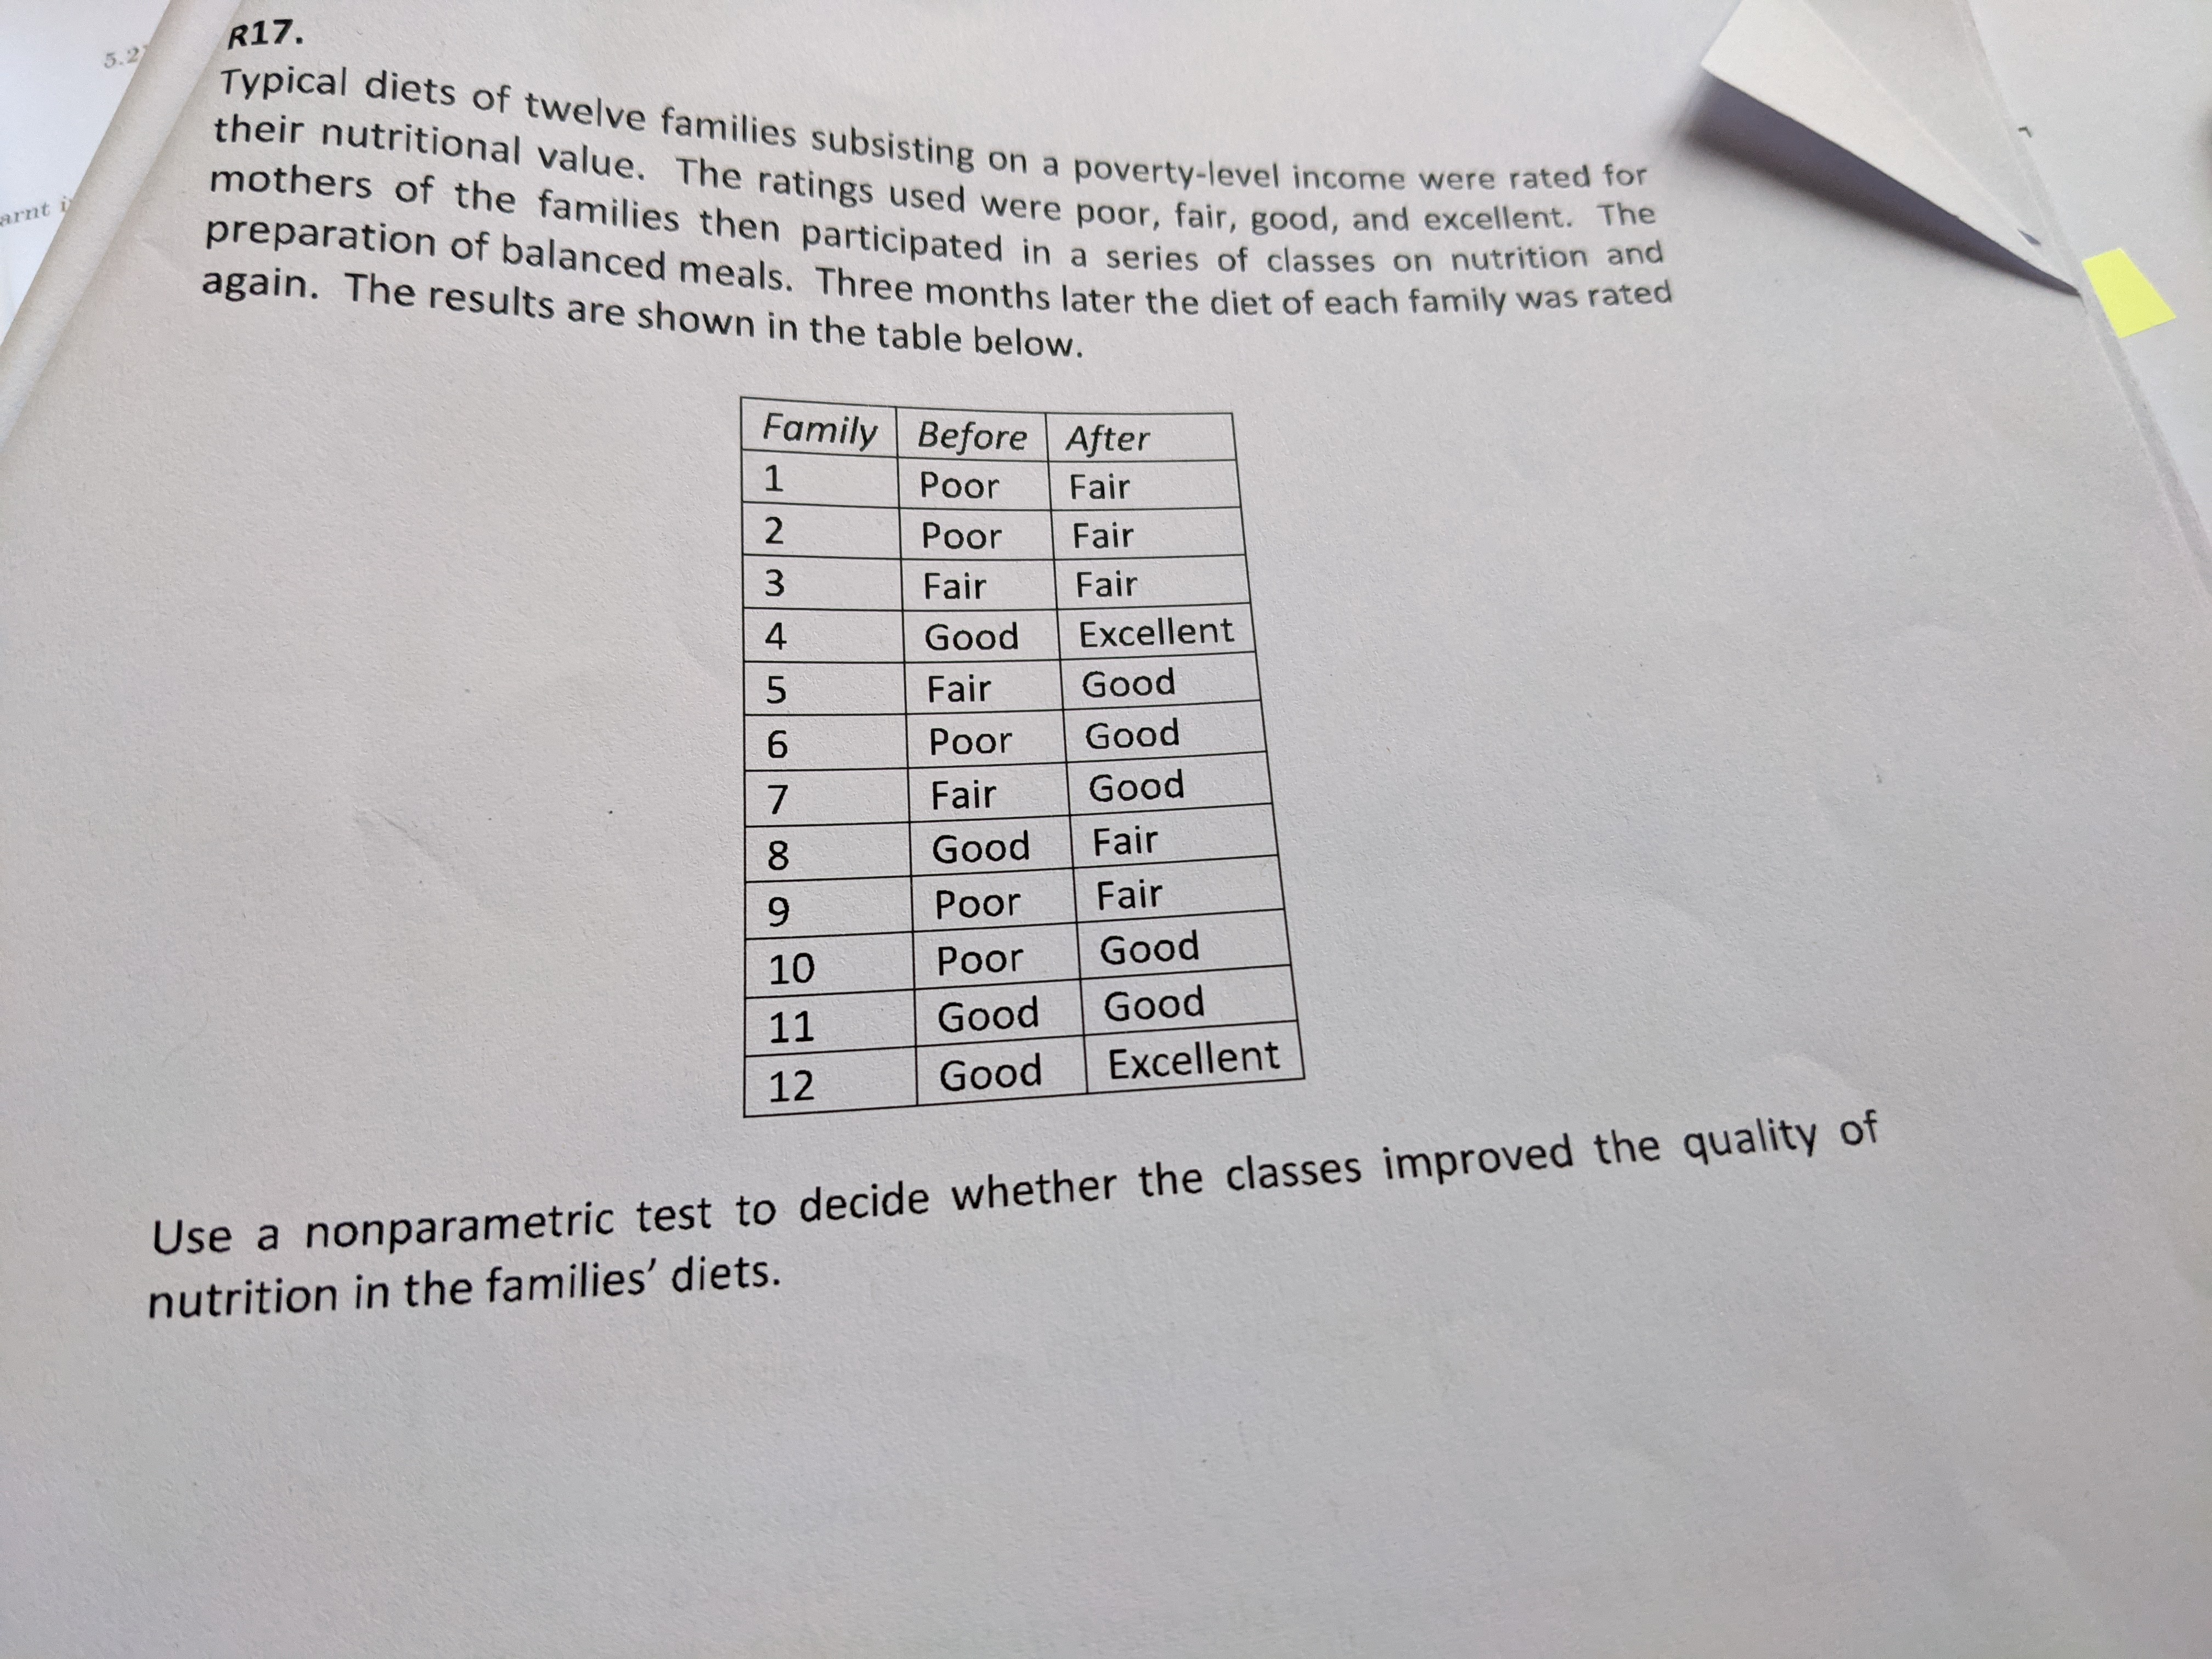
show step by step using appropriate formula and test statistic for this question. all and explain why this particular test statistic was used. write hypothesis
show step by step using appropriate formula and test statistic for this question. all and explain why this particular test statistic was used. write hypothesis as well as finding p value in addition to this scanned question.
Step by Step Solution
There are 3 Steps involved in it
Step: 1

Get Instant Access to Expert-Tailored Solutions
See step-by-step solutions with expert insights and AI powered tools for academic success
Step: 2

Step: 3
Ace Your Homework with AI
Get the answers you need in no time with our AI-driven, step-by-step assistance
Get Started